|
- Interim Update 18th January 2006
Copyright
Reminder
The commentaries that appear at TSI
may not be distributed, in full or in part, without our written permission.
In particular, please note that the posting of extracts from TSI commentaries
at other web sites or providing links to TSI commentaries at other web
sites (for example, at discussion boards) without our written permission
is prohibited.
We reserve the right to immediately
terminate the subscription of any TSI subscriber who distributes the TSI
commentaries without our written permission.
Important Note
Please note that TSI will be
on vacation from Sunday 22nd January until Friday 3rd February,
inclusive. As a result, the Weekly Market Update that would normally
have been posted on Sunday 22nd January will, instead, be posted on
Saturday 21st January and then the next commentary will be the Weekly
Market Update on Sunday 5th February. In other words, we will miss
three commentaries (there will be no Interim Update on Thursday 26th
January, no Weekly Market Update on Sunday 29th January, and no Interim
Update on Thursday 2nd February). If anything dramatic and/or totally
unexpected happens while we are away we will send out a short update
via e-mail, but hopefully that won't be necessary.
The Sea of Liquidity Continues to Rise
...there appear to be forces at work that have more than offset the Fed's attempts to tighten the monetary reins.
The US Fed has now been hiking short-term interest rates for about 18
months, but are monetary conditions in the US actually any tighter
today than they were 18 months ago? After all, with the prices of all
asset classes having gone up in relentless fashion it is clear that the
financial world remains awash in liquidity. Also, despite the Fed's
tightening stance the total supply of US dollars is 8.4% higher today
than it was 12 months ago, which is not the sort of money supply growth
that would normally be associated with even modestly restrictive
monetary policy. Is it possible, therefore, that the Fed is attempting
to give the appearance of running an inflation-fighting campaign while
simultaneously inflating with gusto?
We take no issue with the notion that the Fed would pretend to fight
inflation while working hard to facilitate inflation in the background
because this is the way the Fed often operates. In this case, however,
it looks like the Fed has attempted to slow the pace of credit creation
but has, to date, been unsuccessful. We say this because the monetary
aggregates over which the Fed exerts the most direct influence are
barely higher today than they were 12 months ago whereas the bulk of
the growth has occurred in the monetary aggregates over which the Fed
exerts little direct control*. In other words, there appear to be
forces at work that have more than offset the Fed's attempts to tighten
the monetary reins.
We suspect that the biggest of the aforementioned forces is the borrowing/spending conducted by the US Government.
The debt of the US Federal Government has increased by $557B over the
past year**, so borrowing by the government has added up to $557B to
the total supply of US dollars (the actual quantity of new dollars that
were created would depend on how much of the new debt was monetised).
This is only part of the story, however, because the rate at which the
US Government goes into debt has ACCELERATED over the past few months.
Specifically, since the beginning of October the Federal debt has
increased by $226B, or at an annualised rate $775B.
If the rate at which US consumers borrow new money into existence
continues to fall then the rate at which the US Government borrows new
money into existence will most likely continue to rise. This is what
we've been saying would happen for years in response to the argument
that deflation would become inevitable once US consumers became 'tapped
out'. And it is why gold is such a 'no brainer' as far as long-term
investments are concerned.
*Over the past 12
months M1 -- the monetary aggregate over which the Fed exerts the most
direct control -- has risen by only 0.4%. However, the non-M2
components of M3 -- monetary categories over which the Fed exerts
almost no direct control -- have, as a group, risen by 15.9%. The
non-M2 components of M3 include large time deposits, eurodollars, and
institutional money market funds.
**The year-over-year increase in the Federal Government's debt represents that TRUE annual budget deficit.
The Stock Market
Current Market Situation
The US stock market pulled back over the first two trading days of this
week in response to additional gains in the oil price and disappointing
earnings news from some high-profile stocks. However, considering the
news backdrop the market's performance was actually quite good. In
particular, despite the stock price of the world's largest
semiconductor company (Intel) plunging 11% on Wednesday in response to
a negative earnings surprise, the Semiconductor Index (SOX) was UP on
the day. Also, the number of declining stocks was only slightly higher
than the number of advancing stocks and the Dow Transportation Average
was strong.
We continue to expect that the senior stock indices will move to new multi-year highs over the coming 2 months.
Japan
Japan's Nikkei225 Index was hammered during the first half of this
week. The catalyst for the sharp decline was news that the offices of
an internet-related company had been raided by the authorities as part
of a criminal investigation into the company's securities' dealings,
but we think the magnitude of the reaction has a lot more to do with
the amount of 'hot money' that has flowed into the Japanese stock
market over the past several months than anything else. As we noted in
the 5th December Weekly Market Update, "The
rally [in the Japanese stock market] is underpinned by positive
fundamentals, but the rapid pace of the advance is obviously due to
hedge funds and other professional money managers piling into the
world's best-performing senior stock market in order to maximise
year-end results. These chasers of short-term performance are probably
setting the Nikkei up for a sharp correction during the early part of
next year."
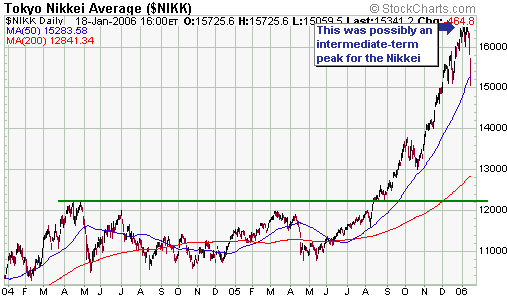
At this stage all we've seen is a 2-day shakeout within an on-going
upward trend, although it is certainly possible that an
intermediate-term peak was put in place for the Nikkei225 Index early
this month (see chart below). A daily close below Wednesday's panic low
of 15,059 for the Nikkei would be strong evidence that an
intermediate-term correction was in progress.
We suggested taking partial profits in iShares Japan (AMEX: EWJ) on 4th
January with the Nikkei trading at around 16,300 and still consider the
16,000-16,500 range to be a reasonable place for some profit taking.
Furthermore, we plan to make a complete exit from EWJ should the
Nikkei225 Index move above 19,000 during the first 4 months of this
year. On the other hand, we think it would be reasonable to accumulate
EWJ if the Nikkei were to move below 14,000 and to buy EWJ aggressively
if the Nikkei were to move below 12,500.

Gold and
the Dollar
Gold
China and Gold
...ALL
of the world's central banks and governments have a vested interest in
keeping the current monetary system going because it's a system that
allows them to get something for nothing.
China's State Administration of Foreign Exchange recently said that one
of its targets for 2006 was to "improve the operation and management of
foreign exchange reserves and to actively explore more effective ways
to utilise reserve assets". This statement generated a great deal of
discussion about the possibility of China selling some of its
US$-denominated reserves and increasing its gold reserves, actions that
would potentially have huge impacts on the currency, bond and gold
markets given the enormity of China's US$ reserves.
China presently holds about US$800B of foreign currency reserves --
most of it US$-denominated -- and is likely to have at least one
trillion dollars of reserves by this time next year. In comparison, the
combined total of gold reserves reported by the world's central banks
is around 30,000 tonnes, or US$530B of gold at the current gold price.
Note, though, that about half of this gold has probably been loaned or
swapped in order to generate income and/or keep a lid on the gold
price, so the actual amount of physical gold in the vaults of the
world's central banks might only be in the vicinity of 15,000 tonnes
(US$265B worth of gold at the current gold price). In other words, if
China's Government decided to make a shift in the way its reserves were
allocated such that in 12 months time 25% of its reserves were gold,
the amount of gold it would need to purchase would be equivalent to the
sum total of all the gold currently held in the vaults of the world's
central banks. Furthermore, even if China decided to convert only 5% of
its dollar-denominated reserves into gold it would need to purchase the
equivalent of one year of the world's total mine supply.
Obviously, if China attempted to shift only a small portion of its
reserves from dollars to gold the effect on the gold price would be
substantial, to say the least. In fact, if China were to go into the
market and convert 5% of its current foreign exchange reserves into
gold it would probably have the effect of doubling or tripling the gold
price. This, quite naturally, is a possibility that excites many gold
bulls.
However, the dramatic effect on the gold price that would be caused by
China making even a small shift out of dollars and into gold all but
eliminates the possibility of such a shift taking place. If China held
a lot less dollars and there was a lot more gold in the world then
shifting reserves from dollars to gold might be feasible, but as things
currently stand it's really not an option.
At this stage inflation fears remain surprisingly low, thus supporting
a high average price/earnings ratio in the US stock market and low bond
yields throughout the world, but the sort of gain in the gold price
that would result from large-scale official-sector buying on the part
of China would change everything. Bond yields would soar, stock prices
would tank, and the US economy would plunge into recession. Knock-on
effects would include a large reduction in the amount of Chinese goods
purchased by US consumers, a recession and burgeoning unemployment in
China, and, quite possibly, enough social unrest in China to threaten
the survival of the current leadership.
What needs to be understood is that ALL of the world's central banks
and governments have a vested interest in keeping the current monetary
system going because it's a system that allows them to get something
for nothing. As long as the vast majority of people have confidence in
today's paper money, that is, as long as most people expect the money
they use every day to do nothing worse than lose its purchasing power
at the rate of 2%-4% per year, then the system will be viable and
governments will be able to pay for their growth by creating money out
of thin air.
The bottom line is that there are many good reasons to expect the gold
price to move much higher over the next few years, but the buying of
gold by China's Government is not one of them. And by the way, if
China's Government ever did decide to break ranks and convert a
meaningful portion of its US$ position into gold it would not publicise
its intention.
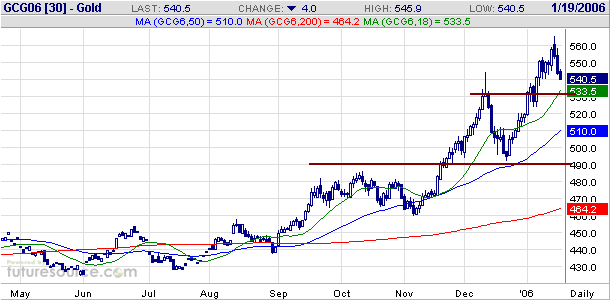
Current Market Situation
Gold is in the midst of a blow-off move that could end at any time, but
there is no evidence that it has already ended. A daily close below
$530 by February gold futures (see chart below) would suggest that the
top was in place.

Gold Stocks
Current Market Situation
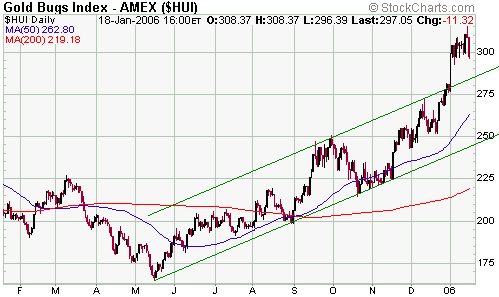
As mentioned in the latest Weekly Market Update, the HUI would have to
move up to 370 in order for the rally that began in May of 2005 to
match the MINIMUM percentage increase achieved during any of the
intermediate-term rallies that occurred during the HUI's first major
upward leg (the one that ended in December of 2003). However, we think
it's unwise to buy the major or mid-tier gold stocks at this time in
anticipation of such an outcome because almost all of these stocks are
extended from both technical and valuation perspectives.
There are still plenty of exploration-stage stocks that offer very good
value, but it's important to be selective. For example, it's generally
not a good idea to buy stocks that have just experienced such large
percentage gains that they now have vertical price charts because what
goes up in a steeply-sloped straight line will usually come back down
the same way.
We will continue to highlight stocks in the TSI commentaries when they reach levels at which new buying becomes appropriate.

Gold Stocks versus Base Metal Stocks
The following chart compares the PD/NEM ratio (the stock price of major
copper producer Phelps Dodge divided by the stock price of major gold
producer Newmont Mining) with the NYSE Composite Index. The chart's
message is that base metal stocks outperform gold stocks when the broad
stock market is trending upward and under-perform gold stocks when the
broad stock market is trending downward. This is another way of saying
that base metals are cyclical whereas gold is counter-cyclical.
The start of the next prolonged period of general stock market weakness
should herald the start of the next multi-year advance in the prices of
gold stocks RELATIVE TO base metal stocks.
Currency Market Update
Below are daily charts of March euro futures and March C$ futures.
Interestingly, the euro appears to be setting up for a break ABOVE
short-term resistance at 1.22 whereas the C$ appears to be setting up
for a break BELOW intermediate-term support at 0.85.
The currency market
has been 'choppy' over the past few months and will probably remain so
for another 1-2 months, after which we expect the dollar's bull market
to resume. The US government's rampant borrowing is clearly a negative
for the dollar, but more so relative to gold than relative to other
forms of paper money. Furthermore, interest rate differentials usually
trump all other considerations over the intermediate-term.
Update
on Stock Selections
 European
Minerals (TSX: EPM) announced on Monday that it was having problems
with its mine construction contractor. The contractor -- MDM Ferroman
-- appears to be experiencing financial trouble and has, at this stage,
been unable to provide the performance bond required under its contract
with EPM. European
Minerals (TSX: EPM) announced on Monday that it was having problems
with its mine construction contractor. The contractor -- MDM Ferroman
-- appears to be experiencing financial trouble and has, at this stage,
been unable to provide the performance bond required under its contract
with EPM.
In our opinion, the worst case outcome for EPM as a result of MDM's
financial difficulties would be a delay of a few months in the
construction of the Varvarinskoye mine. Such an outcome would not
materially alter our valuation or assessment of the stock.
In the latest Weekly Market Update we said that EPM would be suitable
for new buying at around C$0.92, but as a result of Monday's news it
was possible to do a bit better than that because the stock traded in
the low-to-mid C$0.80s during Monday's trading session and during the
early part of Tuesday's session. It closed at C$0.88 on Wednesday.
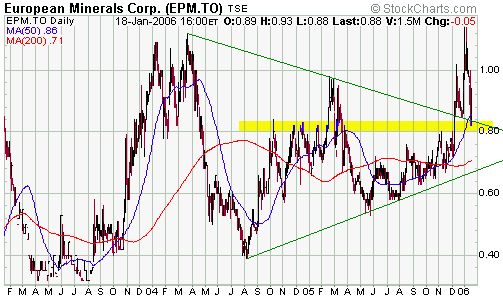
There is good support in the C$0.80-C$0.85 range that SHOULD hold on a
daily closing basis (see chart below). We continue to believe that EPM
is a reasonable stock to accumulate near current levels.

Chart Sources
Charts appearing in today's commentary
are courtesy of:
http://stockcharts.com/index.html
http://www.futuresource.com/

|

