![]()
![]()
![]()
![]()
- Interim Update 18th January 2017
Copyright
Reminder
The commentaries that appear at TSI
may not be distributed, in full or in part, without our written permission.
In particular, please note that the posting of extracts from TSI commentaries
at other web sites or providing links to TSI commentaries at other web
sites (for example, at discussion boards) without our written permission
is prohibited.
We reserve the right to immediately
terminate the subscription of any TSI subscriber who distributes the TSI
commentaries without our written permission.
The US money supply
becomes volatile
From late-2013 through to
mid-2016 the year-over-year (YOY) growth rate of US True Money Supply
(TMS) essentially flat-lined near 8%. Such a long period of sideways
movement in the US monetary inflation rate had not occurred at any time
over the preceding 50 years, so the lack of volatility was notable.
Volatility has, however, returned to the US money supply. As
illustrated below, the YOY TMS growth rate surged from 8% to more than 11%
during July-November of last year and then plunged in December. It's a
good bet that the sharp increase in the monetary inflation rate was partly
responsible for the so-called Trump rally and it's a good bet that
December's monetary inflation reversal will be partly responsible for a
meaningful stock market correction.
The increased volatility in the US TMS growth rate over the past 6
months probably had more to do with what was happening outside the US than
what was happening inside the US. This is because the volatility appears
to have been caused by money flowing into and out of the US.
To
further explain, the US True Money Supply is a calculation of the quantity
of US dollars in the US. It does not count US dollars outside the US, that
is, it does not count eurodollars*. The calculated monetary inflation rate
can therefore be affected by US dollars entering or leaving the US. It
seems that during July-November of last year there was a substantial net
flow of dollars into the US and that in December there was a net flow of
dollars out of the US.
*The Fed gave up
trying to calculate the quantity of eurodollars more than 10 years ago.
Did Cameco just derail
the uranium rally?
The uranium mining sector
recently became extremely 'overbought' and was overdue for a significant
correction. A decline was therefore to be expected, but the pace of the
decline has been accelerated by news from the world's largest listed
uranium miner.
Cameco Corp. (CCJ) surprised the market after the
close of trading on Tuesday 17th January when it warned that its 2016
financial results were going to be well below analysts' estimates and that
its financial performance during 2017 was probably going to be worse than
generally expected. A result was that on Wednesday 18th January the stock
price was down 18% on very heavy volume. Furthermore, CCJ's news and
dramatic sell-off affected the entire uranium-mining sector.
Considering what happened to the uranium market last year and the fact
that the uranium price is still near a 12-year low, CCJ's news shouldn't
have shocked anyone. It's therefore likely that Wednesday's price collapse
had more to do with the near-vertical preceding price rise than the
company news. The market simply got way ahead of itself and needed a
reality check.
CCJ has strong support near US$10 that will probably
be tested within the next few days. This support should hold IF we are
dealing with a routine correction within a continuing rally.
The Stock Market
The US
The Dow Industrials Index has spent the past month 'treading water'
slightly below 20,000. The chart (see below) has the look of a market
rolling over to the downside, but there is still a decent chance that it
will spike above the 'magical' 20,000 level before a significant
correction begins. Perhaps Trump's Inauguration speech on Friday will act
as the catalyst for a trend-ending upward spike.
The UK
The FTSE100 Index has finally ended its
incredible daily winning streak. It did so with a decisive reversal,
potentially kicking-off a downward correction of as much as 10%.
Gold and the Dollar
Gold
The Fundamentals
As pointed out
many times in these reports, the US$ gold price and the bond/dollar ratio
(the T-Bond price divided by the Dollar Index) track each other very
closely. The relationship is illustrated below. This is not a case of
correlation without causation, in that the correlation exists because the
bond/dollar ratio directly or indirectly reflects some of the true
fundamental drivers of the gold price.
The strong potential for a rebound in the bond/dollar ratio, driven
more by a rise in the T-Bond price than by a decline in the Dollar Index,
was one of the two main reasons -- the other being sentiment -- that we
expected a significant rebound in the gold price from its December low. As
evidenced by the above chart, the rebound in the bond/dollar ratio and the
associated rebound in the gold price are well underway.
The rebound
in the bond/dollar ratio is probably not close to reaching a top that
holds for more than a couple of weeks, primarily because sentiment
indicators point to sizable additional gains in the T-Bond price. This is
good news for gold 'longs'. It implies that there should be fundamental
support for a rising gold price over the weeks ahead.
The Price Action
The US$ gold
price broke above resistance in the low-$1200s over the past two trading
days, but it hasn't yet moved high enough to enable this former resistance
to act as support during a routine correction. We therefore won't be
surprised if the gold price moves back below $1200 within the coming few
days and tests its 50-day MA in the $1180s.
Whether or not we get a
near-term pullback to below $1200, the rally from the December bottom is
probably not complete.
Gold Stocks
Although the HUI traded at a new
high for the year on Tuesday 17th January, Tuesday's close was below the
5th January intra-day high and therefore wasn't a breakout. The
gold-mining index needed to gain some ground on Wednesday to effect an
upside breakout, but instead it pulled back and confirmed that it is still
in consolidation mode. As mentioned in the latest Weekly Update, the
consolidation will possibly involve a test of the 50-day MA in the
mid-180s.
220-250 remains our target range for the rally that began
in December.
Muddying the waters a little is the fact that the XAU (the other
senior gold-mining index) has already reached the HUI equivalent of 220,
that is, the XAU has already reached the bottom of our target range. The
XAU's recent relative strength is due to having a copper-mining stock
(FCX) as its largest component.
101 is the top of our target range
for the XAU.
The Currency Market
Has the British Pound bottomed?
Over the past few months
we've written about the British Pound's 8-year cycle -- that since the
1970s the British Pound has made major bottoms at 8-year intervals and
that the next 8-year cycle low was due in early-2017 plus/minus a few
months. The margin of tolerance for this long-term cycle suggested that a
major bottom could have been put in place when the Pound plunged in
October-2016 but might not be put in place until as late as mid-2017.
Here is an update of the long-term monthly Pound chart we've shown in
the past, with green arrows indicating the 8-year cycle lows. The last
green arrow should have a question mark next to it.
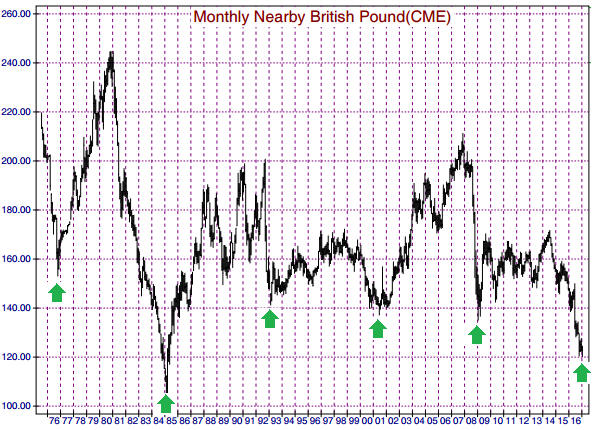
Chart source: http://www.mrci.com/
When revisiting the Pound's 8-year cycle in the 28th November Weekly
Update we wrote that although there was a possibility that the Pound had
bottomed in October-2016, this possibility had a low probability. Our
reasoning was that all previous major bottoms in the Pound had occurred
very close to intermediate-term bottoms in the US$ gold price. With the
US$ gold price having broken well below its October low and not yet
showing any sign of having bottomed, in the context of the past 40 years
it would have been unprecedented if the Pound had bottomed in October.
As an aside, in the coming Weekly Update we'll take a look at gold's
8-year cycle.
With the gold price having rebounded strongly from a
December-2016 bottom and with the Pound having made a marginal new
bear-market low last week before reversing upward, it's appropriate to ask
the question: Is a major bottom now in place for the Pound?
In
favour of a positive answer to the above question is that the financial
markets seem to be getting used to the idea of a 'hard' Brexit. In other
words, it looks like the financial markets are beginning to accept that
there will be no half-in/half-out compromise with regard to the UK's exit
from the EU and that separation from the EU does not constitute a big
threat to the UK economy. This is evidenced by the relatively calm
currency-market reaction early this week to a speech in which Theresa May,
Britain's Prime Minister, made it clear that her government was intent on
negotiating a clean break from the EU.
Interestingly and as
reported in the Sydney Morning Herald article posted
HERE, Mrs May concluded the speech "with a barely veiled threat to
Europe: that if they sought a "punitive" Brexit then it would be "an act
of calamitous self-harm" as the UK would retaliate by lowering its tax
rates below Europe's to draw companies and investors from the continent."
In other words, if the EU isn't reasonable during the Brexit negotiations
then the UK will turn itself into a tax haven, thus giving the UK economy
a huge boost at the EXPENSE of the EU.
All that being said, the
correct answer to the question of whether the Pound has bottomed on a
long-term basis is: it's far too soon to tell. The timing for a Pound
bottom is right and sentiment is consistent with a major price low having
just been put in place, but if the Dollar Index breaks above last year's
high during the second quarter of this year (a likely scenario) then the
Pound could be pushed to a new bear-market low before hitting 'rock
bottom'.
Either way, we expect that the Pound will be trading well
above its current level by year-end.
Current Market Situation
As noted above, there's a chance
that last week's marginal new low will turn out to be THE bottom for the
British Pound, but it's far too soon to draw any conclusion. There is no
nearby 'magic' number that the Pound would have to exceed to signal a
major bottom, but the 50-day MA is acting as a short-term obstacle.
A daily close above 125 would confirm that at least a short-term
bottom was in place.
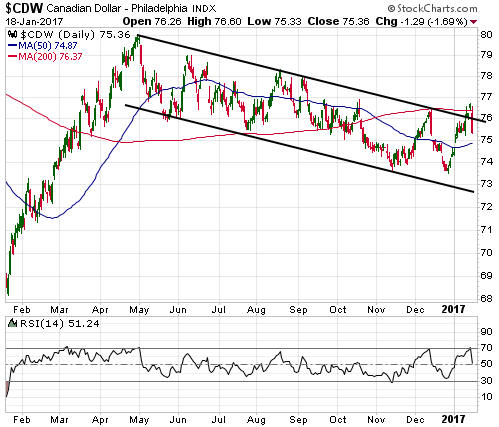
The Canadian dollar (C$) closed above its channel top and its 200-day
MA on Tuesday 17th January. However, the break above important resistance
occurred with the market 'overbought'.
If an upside breakout occurs
when the market in question is already 'overbought', the breakout has a
relatively high risk of failure. Thanks to a sizable decline on Wednesday
18th January, a breakout failure is what the C$'s chart (see below) is now
indicating.
Perhaps the C$ will find support near its 50-day MA and
then make a successful attempt to break out to the upside, but as things
currently stand there is scant evidence that the decline from the
April-2016 peak is over.
Updates on Stock Selections
Notes: 1) To review the complete list of current TSI stock selections, logon at
http://www.speculative-investor.com/new/market_logon.asp
and then click on "Stock Selections" in the menu. When at the Stock
Selections page, click on a stock's symbol to bring-up an archive of
our comments on the stock in question. 2) The Small Stock Watch List is
located at http://www.speculative-investor.com/new/smallstockwatch.html
Chart Sources
Charts appearing in today's commentary
are courtesy of:
http://stockcharts.com/index.html
![]()