|
- Interim Update 18th February 2009
Copyright
Reminder
The commentaries that appear at TSI
may not be distributed, in full or in part, without our written permission.
In particular, please note that the posting of extracts from TSI commentaries
at other web sites or providing links to TSI commentaries at other web
sites (for example, at discussion boards) without our written permission
is prohibited.
We reserve the right to immediately
terminate the subscription of any TSI subscriber who distributes the TSI
commentaries without our written permission.
Jump-starting the economy
Of all the opinions floating around regarding the terrible state of the
economy and what should be done about it, one of the most wrongheaded
involves the idea that reduced consumer spending is a large part of the
problem. This line of thinking leads to the totally false conclusion
that the government should take actions designed to stimulate consumer
spending.
We can't over-emphasise that reduced consumer spending -- and
concomitantly increased saving -- is not part of the problem; it's the
CORRECT response to the underlying problem. It is, in fact, the
necessary first step along the road to recovery. To prevent the economy
from taking this first step is to ensure that the economy becomes
PERMANENTLY weak.
Robert Albertson, the Chief Strategist with Sandler O'Neill &
Partners, 'hits the nail on the head' in an interview posted in the
latest Barrons magazine when he says:
"I'm seeing very odd
interpretations from the government, in particular about what we need.
The government isn't thinking about deleveraging. The government is
talking about jump-starting consumer credit. I hear the word jump-start
all the time. It is such a bad word. Jump-start consumer credit for
what? So we can be more indebted?"
"...We need to reduce the
debt. If you jumpstart credit, you are just going to prolong the
problem and deepen it. What we need now is the patience to de-lever. We
don't need the stimulus package. We need a savings package, but that
couldn't be further from the goals at the moment. The mistake is that
the government believes credit drives the economy, instead of the
economy driving credit. They have got that backward, and this is a very
dangerous time to be misfiring."
As explained in many previous commentaries, it is equally wrongheaded
to believe that the government should attempt to offset the necessary
reduction in consumer spending by increasing its own spending. There
are three main reasons for this: First, the government doesn't have any
savings of its own to spend, meaning that the money the government
spends must be taken from the private sector via taxation, borrowing,
or inflation. Second, government spending is not guided by market
signals (price and profit) and is therefore often non-productive.
Third, direct investment by the private sector tends to decline as the
government gets more involved in economic activity. This happens
because government borrowing 'crowds out' private borrowing and because
the future becomes more uncertain when the whims of politicians take-on
greater importance. For example, as a result of the uncertainty created
in the US economy by the rapid extension of the federal government's
tentacles under Franklin Roosevelt's leadership, direct private sector
investment declined throughout the 1930s.
To get it to make sense, just make a slight change to the wording
If the story unfolds roughly as we expect then a lot of mainstream
economic commentary over the year ahead will begin with the word
"despite". And in most cases the commentary will be a lot closer to the
truth if you replace the word "despite" with the words "because of".
For example, when you hear/read something along the lines of "despite
the government's huge stimulus package and various schemes put in place
to support troubled financial institutions, there are no signs of
economic recovery", just pretend that the commentator said/wrote
"because of the government's huge stimulus package..."
The Stock Market
From Wednesday's email alert:
"Tuesday's sharp drop in
the US stock market broke the S&P500 Index (SPX) downward from its
short-term consolidation. More importantly, it resulted in a new
bear-market low for the BKX/SPX ratio and was a deviation from the
typical post-crash pattern. The risk has therefore increased that
something other than a routine post-crash rebound is occurring.
Having said that, this is
probably a good time to be giving the market the benefit of the doubt.
The reason is that the Dow Industrials Index ended Tuesday's session
right at last November's bear-market low of 7552, meaning that it is
now at an important support level and hasn't yet negated the rebound
scenario. Additionally, the S&P500 Index ended Tuesday's session 1%
above long-term support at 780 and about 5% above its November-2008
closing low, so it, too, has not yet weakened enough to negate the
rebound scenario.
One of the most likely
outcomes is that the Dow spikes to a new bear market low this week
while the S&P500 and NASDAQ100 Indices make higher lows."
The market essentially went nowhere on Wednesday, which was strange
considering the steepness of Tuesday's decline and the close proximity
of major support.
The Obama Administration is churning out new policies at a frenetic
pace and each new policy seems to involve government financial
commitments amounting to tens of billions or hundreds of billions of
dollars. One of the latest policy moves involves spending hundreds of
billions of dollars to help some people stay in homes they can't afford
and that are worth less than the amounts owing on the associated
mortgages. One of the catchphrases being used to sell this scheme is
"saving homes", as if the houses would crumble to the ground, rather
than just change owners, if not for government largesse.
The overall economy will be hurt by government policies designed to
support house prices and homeowners, and so will many of the direct
recipients of the help. The reason is that if someone owes more on a
house than the house is currently worth then from a purely financial
perspective that person would be well advised to hand the keys to the
lending bank. Most of the people that are currently 'underwater' on
their home mortgages will likely be even further underwater a year from
now if they continue to live the so-called home-ownership dream, so
they should immediately cut their losses, begin to rent and begin the
process of strengthening their personal balance sheets.
Perhaps the stock market is having difficulty mounting any sort of
rally because many traders and investors are coming to realise that the
government's attempts to help are counter-productive.
Gold and
the Dollar
Gold Stocks
An Elliott Wave Interpretation
There are so many different Elliott Wave (EW) patterns that any
market's price performance over any timeframe can, with the benefit of
hindsight, be explained in EW terms. Unfortunately, the benefit of
hindsight is never available to us when we are making our
investing/trading decisions, and in real time it is often not possible
to ascertain the correct EW interpretation. For this reason we have
never been interested in risking money based on wave counts, but we
know that some people have been able to make EW Theory work for them.
Although we never base investing/trading decisions on EW Theory we have
read enough EW-style analysis to have a reasonable grasp of how it is
supposed to work. For interest's sake we therefore thought we would
explain our long-term outlook for the gold sector in EW terms. In doing
so we are fitting what we know about wave theory to a view determined
by other methods.
Our interpretation of the HUI's monthly chart in EW terms is shown
below. In brief, we think the most appropriate way to describe the
HUI's price action in wave terms goes like this:
a) The first major impulse wave (Wave 1 of 5) began in November of 2000 and ended in May of 2006
b) Even though the HUI moved well above its May-2006 peak during the
final quarter of 2007 and the first quarter of 2008, the price action
between May of 2006 and October of 2008 formed the first major
corrective wave (Wave 2 of 5). Wave 2 took the form of an A-B-C decline.
c) The second major impulse wave (Wave 3 of 5), which will, in turn, be
split into five waves comprising three impulse waves and two corrective
waves, began in October of 2008. We are currently in the first impulse
wave (Minor Wave 1) of Major Wave 3.
Note: The idea that the HUI's September-2007 through to March-2008
surge to well above its May-2006 peak was a counter-trend move within a
multi-year downward correction might seem strange at first impression,
but there are two reasons why we think it is the most reasonable
interpretation. First, only a small number of gold stocks participated
in the rally to a meaningful degree (very few made new highs). As we
noted at the time, this was a period when the HUI and the other
gold-stock averages did poor jobs of representing the performance of
the average gold stock. Second, the October-2008 collapse in the gold
sector makes more sense if viewed as the final capitulation in a
multi-year correction.

If Wave 3 really did
begin last October and if it ends up matching Wave 1 in magnitude then
the HUI will rise to around 1500 over the next few years. Only
'died-in-the-wool' gold bulls probably expect the HUI to achieve that
sort of performance, but it should be noted that the third wave is
often of greater magnitude than the first wave. In other words, if our
wave count is correct then 1500 would be a minimum target.
As we said above, we aren't basing anything on wave counts. The above
is simply the wave-related interpretation that in our opinion most
closely matches what has happened and what will happen.
Current Market Situation
On Wednesday the HUI closed above its 200-day moving average for the
first time since last July and made a new ALL-TIME high relative to the
S&P500 Index (meaning that the HUI reached its highest level
relative to the S&P500 since its creation in early 1996). The new
high in the HUI/SPX ratio supports our view that as gut-wrenching as
last year's gold-stock decline was, it was a correction within an
on-going bull market.
On the negative side of the ledger, the bearish divergences mentioned
over the past week (the divergence between the HUI and the HUI/gold
ratio and the divergence between the HUI and RGLD) remain firmly in
place. Also, in the silver discussion included below we mention another
potentially significant bearish divergence. These divergences suggest
that the gold sector will reach an intermediate-term peak within the
next two months.
With regard to our own accounts, in Wednesday's email alert we noted
that we had just made a partial exit from three of our gold stocks and
planned to do some additional selling if prices continued to move
upward over the days ahead. We also noted that this selling was done
purely for money-management purposes in that recent price gains had
caused our exposure to the stocks in question to become larger than we
were comfortable with. We did some additional pruning on Wednesday, but
our exposure to the gold sector still dwarfs our exposure to anything
else.
We expect that our gold-related stocks will relinquish their relative
strength and that our non-gold stocks will begin to do much better once
the broad stock market reverses upward, assuming, of course, that the
broad stock market does actually reverse upward. We therefore plan to
use some of the cash raised by making partial exits from gold stocks to
increase our exposure to non-gold stocks (primarily natural gas,
uranium and airline stocks), but most of the cash will be kept in
reserve -- ready to be re-deployed into the gold sector as
opportunities arise. Gold is the only real bull market.
Gold
The following monthly chart shows that gold blasted above long-term
resistance at $720 during the final quarter of 2007 and then blasted
above long-term resistance at $850 during the first quarter of 2008.
This completed the first leg of its bull market. The chart also shows
that the first major bull market correction took the price all the way
back to former long-term resistance (now support) at $720.
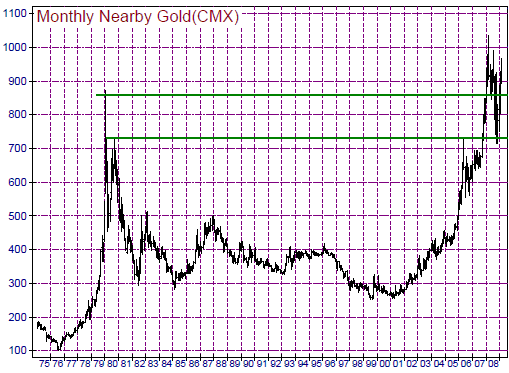
Chart Source: www.mrci.com
The following daily
chart shows that gold recently confirmed an end to its bull-market
correction by decisively breaking the sequence of declining tops that
occurred between March and October of last year. However, it is now
modestly 'overbought' as it nears intermediate-term resistance at
$1000-$1040. In euro terms it is very 'overbought'.
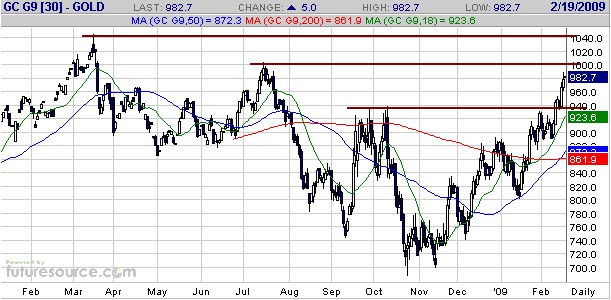
We think that
downside risk from here is limited to a re-test of long-term support at
$850. Upside potential is probably limited by resistance at $1000-$1040
in the short-term, but if economic confidence continues to deteriorate
then we could get an upward explosion in the gold price. The small, but
not insignificant, risk of an upward explosion combined with the
minimal downside risk is why we are maintaining an intermediate-term
bullish view at this time.
Silver
The good news is that the silver price has broken above resistance at
US$14, suggesting an upside target of $15-$16 for the current rally.
The bad news is that a potentially significant bearish divergence is
developing between the silver price and the PAAS/silver ratio,
suggesting that an intermediate-term peak will be in place in the
silver market by the end of next month. As we explained in the Interim
Update posted on 27th February 2008:
"The PAAS/silver ratio
(the price of Pan American Silver divided by the price of silver) tends
to peak and begin trending lower at least 6 weeks prior to an
intermediate-term peak in the silver price. We therefore consider an
upwardly mobile silver price combined with a multi-week downturn in the
PAAS/silver ratio to be a bearish divergence, especially if it occurs
after silver has been trending higher for at least 6 months."
In February of 2008 we cited the relative performances of silver and
the PAAS/silver ratio as evidence that the silver market would reach an
intermediate-term peak by early April at the latest. As it turned out,
the peak was in mid March.
On the following chart comparison of the silver price (the top section
of the chart) and the PAAS/silver ratio (the bottom section of chart)
we've highlighted the 6-week bearish divergence that occurred during
the first half of 2004, the 3-month bearish divergence that occurred
during the first half of 2006, the 3-month bearish divergence that
occurred during the first half of 2008, and the divergence that has
occurred over the past 6 weeks. One notable difference between the
current situation and the earlier bearish divergences is that silver is
presently not at, or close to, a new high for the bull market, but this
is not a good reason to assume that the end result will be different.
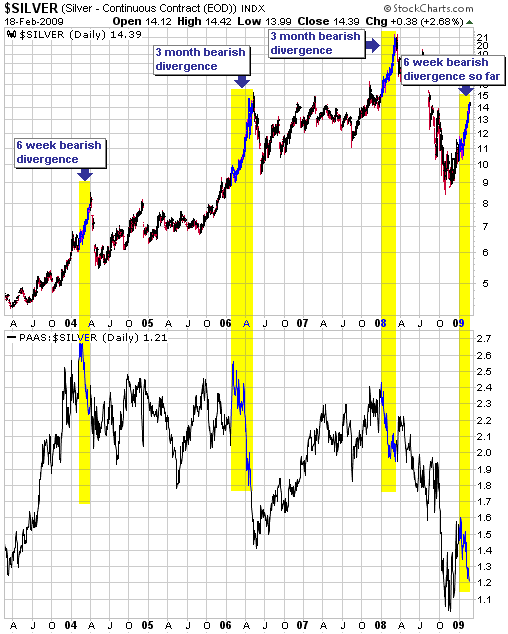
It is possible that
strength in the general stock market over the weeks ahead will result
in sufficient gains in the stock price of PAAS relative to the price of
silver bullion to eliminate the bearish divergence discussed above. On
the other hand, additional gains by silver that are not confirmed by
new multi-month highs in PAAS/silver will increase the probability that
an intermediate-term peak is close at hand.
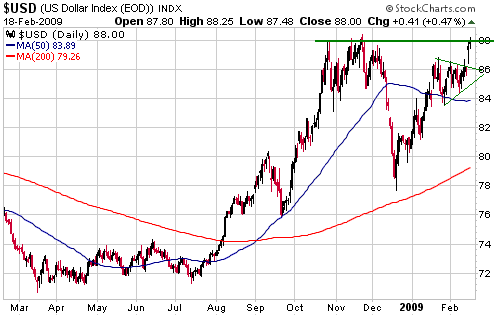
Currency Market Update
A daily chart of the Dollar Index is presented below.
The Dollar Index broke upward from its multi-week consolidation at the
beginning of this week. The upside breakout pointed to a test of the
November peak, but this has already occurred so a short-term peak could
be at hand. Whether it is or not will largely depend on whether a
short-term bottom is at hand in the broad stock market.
Update
on Stock Selections
(Note: To review the complete list of current TSI stock selections, logon at http://www.speculative-investor.com/new/market_logon.asp
and then click on "Stock Selections" in the menu. When at the Stock
Selections page, click on a stock's symbol to bring-up an archive of our comments on the stock in question)
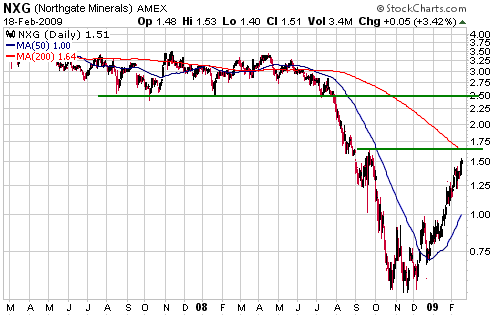
 Northgate Minerals (AMEX: NXG, TSX: NGX). Shares: 255M. Recent price: US$1.51 Northgate Minerals (AMEX: NXG, TSX: NGX). Shares: 255M. Recent price: US$1.51
The weakness in the Australian Dollar combined with the strong US$ gold
price should ensure that NXG's Australian gold operations generate
substantial cash flow during Q1-2009. Furthermore, these operations
could generate sufficient cash flow over the remainder of this year to
fund much of the construction of the company's Young-Davidson gold mine
in Canada.
Like many gold stocks, NXG has risen a great distance from its lows of
the past few months and now looks extended on a short-term basis. Also,
the following daily chart shows that it will soon encounter short-term
resistance. However, we doubt that it is close to an intermediate-term
peak. Our longer-term valuation, assuming that Young-Davidson is
brought into production over the next 2 years and a gold price in the
US$900-$1000 range, remains at US$5/share. Also, the stock won't
encounter intermediate-term resistance until it reaches US$2.50.
In our opinion it is not too late to buy NXG, although the optimum time
for new buying would be following a pullback to US$1.25-$1.30.
We added a trading position in Precision Drilling (NYSE: PDS) via
Wednesday's email alert. The stock got even cheaper during Wednesday's
trading session and ended the day at US$2.41, down a further 0.09. It
has now fallen for 7 days in succession and on 14 of the past 15 days.
We will probably add one or two more trading positions when we see
evidence that the stock market has reached a short-term bottom.
Chart Sources
Charts appearing in today's commentary
are courtesy of:
http://stockcharts.com/index.html
http://www.futuresource.com/

|