|
- Interim Update 18th April 2012
Copyright
Reminder
The commentaries that appear at TSI
may not be distributed, in full or in part, without our written permission.
In particular, please note that the posting of extracts from TSI commentaries
at other web sites or providing links to TSI commentaries at other web
sites (for example, at discussion boards) without our written permission
is prohibited.
We reserve the right to immediately
terminate the subscription of any TSI subscriber who distributes the TSI
commentaries without our written permission.
The
"Mistake of 1937"
The US Great Depression lasted from 1929 until 1945, but the deflationary phase of the Depression effectively ended in 1932. Regardless of whether you define deflation and inflation in terms of money supply or prices, there was almost continuous inflation in the US after 1932. The inflation was, however, briefly interrupted during 1937-1938, when a leveling-off in the money supply and a sudden economic downturn led to sharp declines in equity and commodity prices. The 1937-1938 downturn is sometimes called the "mistake of 1937" by those who believe that it only occurred because the Fed tightened monetary policy prematurely. According to the believers in this theory, the US economy would have continued to recover from the collapse of 1929-1932 if not for the Fed's premature tightening. Significantly, Ben Bernanke is one of the believers.
Believers in the theory that the collapse of 1937-1938 was caused by the Fed's premature tightening of monetary conditions are partially right in that modest Fed tightening during the second half of 1936 and the first half of
1937(1) was probably the catalyst for the collapse. The question that this theory fails to address is: if a genuine economic recovery had got underway in 1933, then why did the recovery fall apart so rapidly and so completely following only a minor tweaking of monetary conditions? The answer is that the recovery wasn't real; it was an illusion based on increasing money supply. When economic growth is mainly the result of increasing money supply then stopping, or even just slowing, the rate of money-supply growth will likely bring about a collapse.
(As an aside, the recovery's flimsy monetary underpinning is part of the reason why, like the recovery that began in mid 2009, it was essentially "jobless" (the unemployment rate remained very high throughout the 1933-1937 rebound). However, there was more to the relentlessly high unemployment of the 1930s than the Fed's counter-productive monetary machinations. Actions taken by the Hoover and Roosevelt administrations to raise the price of labour can also be given a lot of credit for keeping people out of work.)
This prompts the question: shouldn't the Fed have continued to 'support' the economy with a constant flow of new money until a real recovery was able to take hold?
The above question ignores the fact that the flow of new money (monetary inflation) leads to more mal-investment and thus not only gets in the way of a real recovery, but also further weakens the economic structure. Had the Fed continued to provide monetary support for an additional year then the collapse would have commenced in mid 1938 rather than mid 1937. Also, it would have been even more devastating thanks to an additional year of mal-investment. As Ludwig von Mises pointed out long ago: "There is no means of avoiding the final collapse of a boom brought about by credit expansion. The alternative is only whether the crisis should come sooner as the result of voluntary abandonment of further credit expansion, or later as a final and total catastrophe of the currency system involved."
The above question also ignores the fact that in real time the central bank finds itself between the proverbial rock and a hard place. Even when the economy is subject to natural deflationary forces, as it was in the mid-1930s, the unnatural creation of new money by the central bank will eventually cause evidence of an inflation problem -- in the form of rising prices for important commodities and some goods and services -- to emerge. After a while, the pressure on the central bank to curtail the inflation problem can become greater than the pressure on the central bank to 'support' the economy with a continuing flow of new money.
By the third quarter of 1936 the pressure on the Fed to curtail the inflation problem had become dominant, but if the Fed had ignored this pressure and instead persisted with its price-boosting policies -- the path that Monday-morning
Keynesians(2) now say should have been taken -- then the end result would have been an even more severe economic downturn once monetary conditions were eventually tightened. Alternatively, the Fed could have chosen to rapidly inflate the money supply indefinitely, in which case the end result would have been total catastrophe for both the US dollar and the US economy.
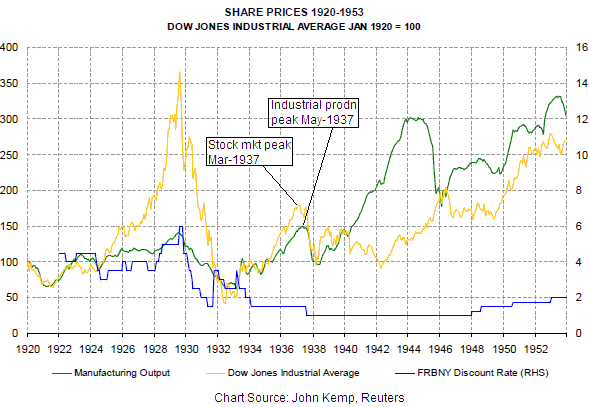
A picture of what happened during 1937-1938 is displayed below. On the chart the 1937-1938 downturn looks minor in comparison to the 1929-1932 downturn, but it was substantial nonetheless. The Dow Industrials Index lost more than half of its value, but perhaps of greater significance was the quick one-third decline in manufacturing output. Considering the relative importance of manufacturing in those days, this effectively means that the economy quickly shrunk by one-third.
The chart also shows that the Fed made no attempt to tighten via a higher official interest rate. As explained in Note (1) below, the Fed used other means to restrict the flow of new money.
That many of today's most influential policymakers and economists believe that a severe downturn could have been avoided during the late-1930s if only the Fed had maintained its ultra-easy monetary stance means that the wrong lesson has been learned from history. This, in turn, almost certainly means that the Fed will stay loose for longer in the face of blatant evidence of an inflation problem this time around, and that the Fed will be quicker than ever to engineer a money-supply boost in reaction to the next bout of economic weakness.
(1) The Fed started tightening the monetary reins in August of 1936. It never went as far as hiking the official interest rate (the "Discount Rate"), but it did increase bank reserve requirements and took actions to prevent gold in-flows to the US Treasury from boosting the Monetary Base. The result was a leveling-off in the money supply during the 2-year period beginning in late-1936.
(2) A Monday-morning Keynesian is an economist who always knows, with the benefit of hindsight, how much 'stimulus' should have been provided to the economy to bring about a sustainable recovery. Since these economists begin with the premise that monetary and/or fiscal stimulus helps the economy, if an economy tanks despite the concerted application of stimulus measures they inevitably conclude that the stimulus was insufficient. They never seriously question the correctness of the underlying premise. The
Libertarian solution to pollution
In the 14th March 2012 Interim Update, as part of a discussion on the government's attempts to "manage" the climate, we wrote:
"...pollution is a property rights issue. At least, that's what it should be. If you pollute my water then you should be obligated to make recompense for the violation of my property rights. Furthermore, if government has a legitimate role it is as the protector of property rights. No special environmental regulations or economic interventions are required for it to perform this role. Unfortunately, the government of each country is now that country's biggest violator of property rights."
Those interested in finding out details of how the proper enforcement of private property rights would deal with the pollution problem should read Murray Rothbard's
"The Libertarian Manifesto On
Pollution", which was posted as an article at www.mises.org early this week.The Stock Market
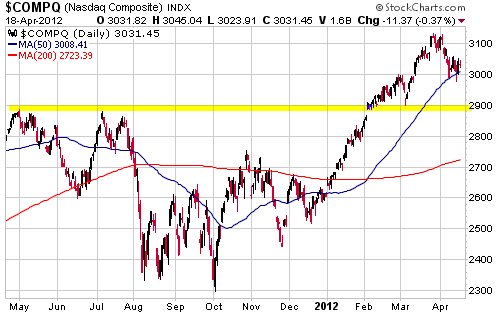
Despite having experienced only a minor pullback from its high, by the middle of last week the US stock market had become very 'oversold' by some measures. For example, in last week's Interim Update we mentioned that the NASDAQ's McClellan Oscillator (MO) had just fallen to near its lows of the past three years. We suspect that the reason the market appeared to become so 'oversold' so quickly is that while the senior stock indices only began to 'correct' in early April, the majority of stocks had been in correction mode since early February.
Last week's MO extreme could have marked the correction low, but it is more likely that there will be another leg down before a short-term bottom is in place. Ideally, at some point over the next few weeks we will get a divergence between the NASDAQ Composite Index and its MO, with the NASDAQ dropping to a new low for the move and the NASDAQ's MO making a higher low. We say "ideally" because such divergences have, in the past, been reliable indicators of short-term lows.
If/when the NASDAQ does break below last week's low, support at around 2900 will become a reasonable target.
The senior US stock indices have just begun to pull back after reaching multi-year highs, but right now these indices aren't good proxies for stocks in general. The fact is that most US stocks and the vast majority of global stock indices have not made new multi-year highs over the past couple of months. Evidence to substantiate this statement is provided by the following daily chart of the Dow Jones World Stock Index (DJW), an index that combines the stock markets of 46 countries.
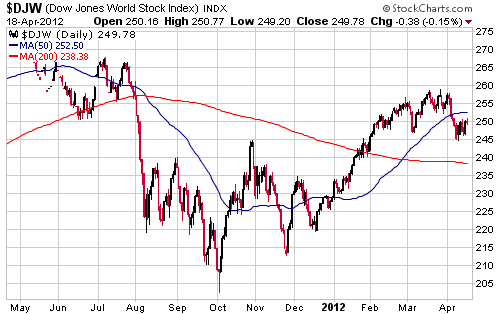
When we look at the charts covering stock market performance for the most important developed and "emerging" economies, we see that the peaks that were put in place during the final quarter of 2010 or the first half of 2011 are yet to be exceeded. In fact, in most cases these peaks are yet to be challenged. This doesn't necessarily tell us anything about the future. What it does tell us is that we should stop using the S&P500 Index (the most important US stock index) as our primary indicator of equity performance. We will continue to pay close attention to what's happening in the US stock market, but from now on the DJW will be our preferred stock market proxy.
Gold and the Dollar
Gold
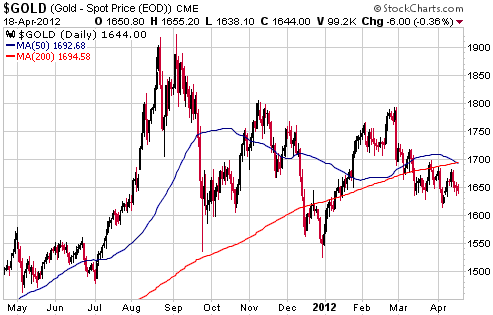
Judging by sentiment you'd think that the gold price had just collapsed, but the reality is that over the past 5 weeks gold has traded sideways in a narrow range. A short-term bottom hasn't yet been confirmed, which leaves open the possibility of a quick decline to support at $1550-$1600. However, there is nothing that we can see in the price action or the fundamentals to suggest that something more serious than a run-of-the-mill consolidation is underway on both a short-term and an intermediate-term basis.
Gold Stocks
For anyone with substantial exposure to gold and silver stocks, the recent price action probably feels like Chinese water torture. The sell-off has been laboured, but relentless. It has been 10 days since the HUI made a new low for the move, but during this period it has shown no signs of strength and many individual stocks have made new multi-year lows.
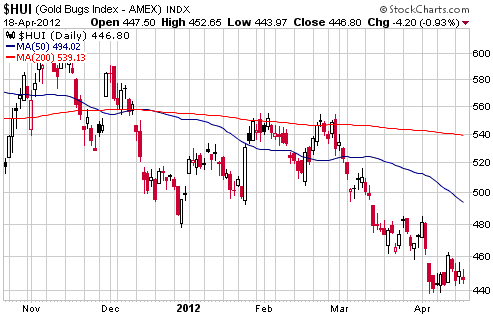
It's important to not have a fixed view as to when the next major (1-3 year) gold-stock upward trend will begin. It could begin within the next few days, but it possibly won't begin for another 12 months. Considering current valuations and sentiment it is almost inconceivable that the start of the next major upward trend could still be 12 months away, but an additional delay of this magnitude would be consistent with the 1970s model.
Even if the start of the next major advance is delayed until next year, between now and then there will almost certainly be a rally lasting 4-7 months. This rally should provide good profit-taking opportunities for gold and silver stocks that were accumulated over the past several weeks and are accumulated over the weeks immediately ahead.
We have been gradually buying for our own account, which has caused our cash percentage to fall from around 40% to around 30%. We plan to continue picking away at very under-valued junior gold stocks with solid balance sheets, but we won't reduce our cash percentage much further unless there is an unexpected crash.
Currency Market Update
From a recent report by Carmel Asset Management, here are five reasons why Spain's problems are worse than the market anticipates:
1. Spain's national debt is 50% greater than the headline numbers
(Spain's debt-to-GDP balloons from 60% to 90% of GDP with regional and other debts)
2. Spain's housing prices will fall by an additional 35%
(Spain built one house for every additional person added to the population during the past two decades; the fall will decrease GDP by about 2% in each of the next two years)
3. Spain has "zombie" banks with massive loans to developers and to homeowners
(Banks have not begun to realize losses and are vastly undercapitalized)
4. Spain's economy has not stabilized and will continue to deteriorate
(Spain has the highest unemployment in the developed world, one of the highest overall debt loads, and the most uncompetitive labor market in Europe)
5. The EU will not have the firepower or political will to bail out Spain
(Rescue fund headline numbers are misleading and count capital that is not yet committed)
As to whether or not Spain's government will be bailed out (point 5 above), our opinion is that politics will be the main determinant. The reason is that the ECB can effectively provide unlimited monetary firepower, thus spreading the cost of the bailout across all holders of euros.
The current situation and trends tell us that the point will eventually be reached -- probably within the next 12 months and almost certainly within the next 18 months -- when the EU's leadership will have to decide whether or not to bail out Spain's government and bondholders. The cost of such a bailout would be many times greater than the cost incurred in the earlier attempts to bail out Greece, but, as noted above, no bailout would be too big if the ECB were on board. In any case, regardless of what the EU's leadership ultimately decides, the uncertainty that will arise as Spain's predicament worsens will probably cause the euro to weaken substantially against the US$.
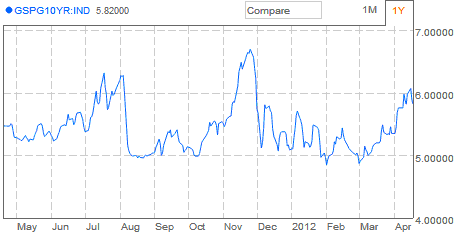
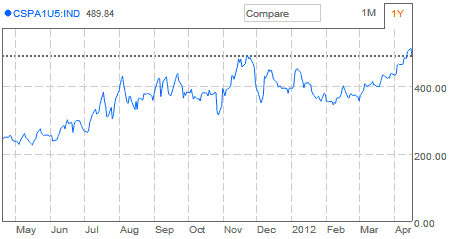
The yields on Spanish government bonds and the cost to insure Spanish government debt against default are the obvious things to watch to determine if the financial markets are making a decisive shift from "we can ignore Spain for the time being" to
"oh no, Spain is about to collapse!" These indicators currently reveal that the markets are nervous and that it wouldn't take much to bring about the aforementioned shift. For instance, the first of the following Bloomberg charts shows that the yield on 10-year Spanish government bonds made a new high for the year early this week before pulling back over the past two days, but is yet to seriously challenge last year's high. The second of the following Bloomberg charts shows that the price of the Credit Default Swap (CDS) linked to 5-year Spanish government bonds is currently testing last year's all-time high, meaning that it has never been more expensive to insure euro-denominated Spanish government debt against default.
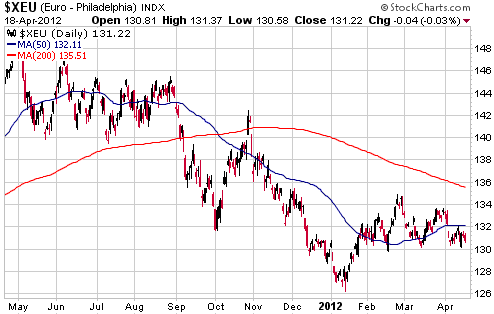
The euro's recent price action can best be described as noncommittal. "Technical analysts" can use their imaginations to arrive at bullish or bearish interpretations of the following daily euro chart, but the reality is that the euro has essentially done nothing since late January. It has been held back by simmering fears of European sovereign debt default and it has been supported by the combination of short covering, the alleviation of a temporary US$ shortage within Europe's banking system (as evidenced by the large reduction in "Central Bank Liquidity Swaps"), and strength in the stock market. We continue to expect that it will exceed its February high before resuming its longer-term downward trend, but we also acknowledge the possibility that significant additional weakness in the stock market over the coming fortnight will push it back to the vicinity of its January low.
Update
on Stock Selections
Notes: 1) To review the complete list of current TSI stock selections, logon at
http://www.speculative-investor.com/new/market_logon.asp
and then click on "Stock Selections" in the menu. When at the Stock
Selections page, click on a stock's symbol to bring-up an archive of
our comments on the stock in question. 2) The Small Stock Watch List is
located at http://www.speculative-investor.com/new/smallstockwatch.html
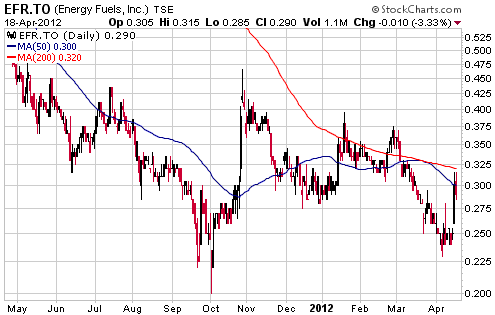
 Energy Fuels Inc. (TSX: EFR). Shares: 212M issued, 230M fully diluted. Recent price: C$0.29 Energy Fuels Inc. (TSX: EFR). Shares: 212M issued, 230M fully diluted. Recent price: C$0.29
It was announced after the close of trading on Monday that EFR and Denison Mines (TSX: DML) had done a deal whereby EFR would acquire all of DML's US-based uranium assets. The agreed price for the assets is 425M EFR shares, or 66.5% of the company. The price is substantial, but, then, so are the assets being purchased.
The Utah-based White Mesa uranium mill is the most important asset that will be gained by EFR as a result of this deal. It is the only currently-producing uranium mill in the US and is slated to produce 1.4M pounds of uranium in 2012 at a cost of about $34/pound (net of vanadium and other byproduct credits). Of particular relevance, the licensed capacity of the mill is 8M pounds.
EFR already has government approval to build the Pinon Ridge mill, which, when complete, will be the second operating uranium mill in the US. However, Pinon Ridge's development has been slowed by a legal challenge. EFR will hopefully get past the legal challenge and thus maintain Pinon Ridge's value, but there will no longer be any pressing need for it to build the mill. After all, the White Mesa mill is in the same general area as the proposed Pinon Ridge mill, and there is a lot of scope to expand White Mesa's production given the large gap between its current output and its licensed output. In fact, the existing spare capacity at White Mesa is more than three times the capacity of the proposed Pinon Ridge mill. This means that all the feed that would have gone to the Pinon Ridge mill could, instead, go to the White Mesa mill.
Current and prospective shareholders of EFR and DML should listen to the 17th April conference call in which the deal's rationale was discussed in detail. A link to the archived call can be found at the top right-hand corner of
EFR's home page.
Once this deal is completed EFR will be the premier US-based uranium mining company. All it will need to fully capitalise on this position is a listing on the NYSE and a uranium bull market. Obviously, only the first of these is within the company's control.
By the way, EFR intends to do a 1-for-10 share consolidation concurrently with the deal's completion. This means that EFR's post-deal share count will be 64M (68M on a fully diluted basis).
For investors wanting increased exposure to uranium, EFR is a buy at around C$0.30.
Call Option Speculations
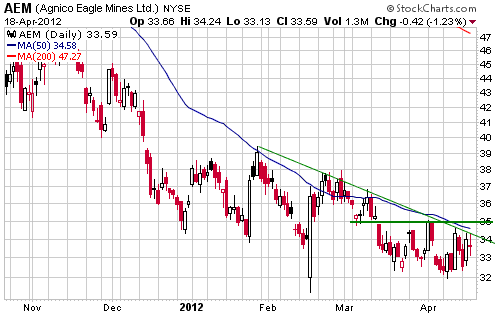
We don't have any direct interest in Agnico Eagle (AEM) or Kinross Gold (KGC), but we do have an indirect interest in these beaten-down senior gold stocks in the form of long-dated call options.
AEM's chart currently has the look of a bottoming pattern, with an intermediate-term low in mid February and a successful test of the low in early April. Consecutive daily closes above $35 would shorten the odds that the stock had bottomed on an intermediate-term basis.
KGC's chart doesn't contain any evidence that a bottom is in place. It is simply a picture of stock that has been sold...and sold...and sold. In its favour is a valuation that is low even relative to the low valuations of most other large and mid-tier gold producers. Its relatively low valuation should allow KGC to spring back after the gold-stock indices reverse upward.

Chart Sources
Charts appearing in today's commentary
are courtesy of:
http://stockcharts.com/index.html

|
