![]()
![]()
![]()
![]()
- Interim Update 18th April 2018
Copyright
Reminder
The commentaries that appear at TSI
may not be distributed, in full or in part, without our written permission.
In particular, please note that the posting of extracts from TSI commentaries
at other web sites or providing links to TSI commentaries at other web
sites (for example, at discussion boards) without our written permission
is prohibited.
We reserve the right to immediately
terminate the subscription of any TSI subscriber who distributes the TSI
commentaries without our written permission.
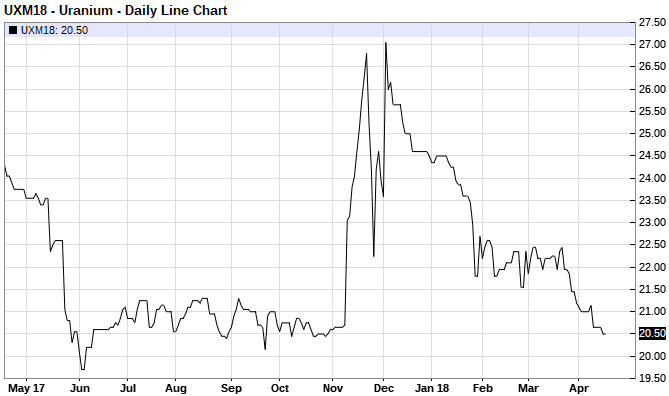
Strange uranium-mining
rally
The first of the following daily
charts shows that the Global X Uranium ETF (URA), a proxy for the
uranium-mining sector of the stock market, has rebounded strongly over the
past three weeks. This is a rather strange sentiment-driven rally, because
the second of the following daily charts shows that over the same period
there were no signs of life in the uranium futures market. Instead, over
the past three weeks the uranium price extended the downward trend that
got underway in December.
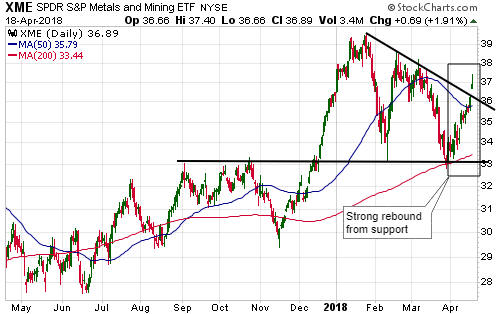
It's likely that uranium-mining equities have been boosted by an
increase in demand for mining equities in general, which, in turn, is
related to anticipation of a US$ breakdown and, more recently,
ill-conceived
US government sanctions against some major Russian commodity producers.
The general mining rebound is illustrated by the following chart of
the S&P Metals and Mining ETF (XME).
Due to the complete absence of support from the uranium price, we
think that the current rally in uranium-mining stocks should be viewed as
a selling opportunity. There are presently no uranium stocks in the TSI
List, but in our own accounts there is exposure to uranium via the shares
of Energy Fuels (EFR.TO). For your information, we probably will exit this
position if there is significant additional share-price strength over the
coming few weeks.
The Stock Market
The most interesting development
over the first three days of this week was the relative weakness in the
banking sector. As illustrated by the following chart, the Bank Index
(BKX) has dropped back to near its low for the year and the BKX/SPX ratio
has plummeted. Furthermore, this weakness occurred in parallel with bank
quarterly earnings reports that were superficially good.
As an
aside, the pronounced relative weakness in the banking sector over the
past three days is the main reason for the bullish shift in our gold model
discussed later in today's commentary.
We can't come up with a good explanation for the sudden bout of
relative weakness in the banking sector. It could be argued that the
demand for bank stocks is declining due to a rise in the banking
industry's interest expense relative to its interest income, but the
contraction of bank interest margins is not a new development and
therefore cannot be the main reason. Also, the valuations of most US bank
stocks are low relative to the S&P500's valuation, so the problem isn't
that bank stocks are too richly priced.
Before we dive more deeply
into this issue we want to see if the relative weakness persists. If it
does it will have implications for other markets, most notably the gold
market.
Moving on, more evidence emerged over the past three days
that the US stock market has completed its downward correction. We are
referring to the fact that both the SPX and the NDX achieved consecutive
daily closes above their respective 50-day MAs. Naturally, the NDX's break
above its 50-day MA was mirrored by the QQQ, a daily chart of which is
displayed below.
As previously mentioned, we bought a small position in QQQ put options
due to the risk of a trend-ending plunge below the February low. This
position will be exited within the next few days, leaving our account
devoid of short-term bearish speculations apart from some TSLA put
options.
The biggest short-term threat facing the stock market now
is the same as the biggest threat that has faced it since the beginning of
the year: higher interest rates. The stock market has become accustomed to
a 10-year bond yield in the 2.80%-3.00% range, but it's likely that at
some point over the coming three months the 10-year yield will move well
above 3.00%. When it does it should usher in the next bout of extreme
stock-market volatility.
Gold and the Dollar
Gold
The Fundamentals
A week ago, we
wrote: "...the fundamental backdrop -- as indicated by the GTFM -- is
very close to turning gold-bullish. In fact, the GTFM shifted into bullish
territory on 11th April, but for a shift to be official it must be based
on weekly closing levels."
It turned out that last week's
mid-week shift into bullish territory by the GTFM wasn't sustained until
the end of the week.
We are presently faced with another bullish
intra-week shift in gold's true fundamentals, in that the GTFM turned
bullish on Tuesday 17th April. Again, though, the shift must be confirmed
by the weekly close in order for it to count.
The Price Action
The gold price
gained a small amount of ground over the first three days of this week,
but the chart pattern is essentially the same as it was at the end of last
week. It's still the case that important resistance lies in the low-$1360s
and that the gold price must achieve a weekly close above this resistance
to signal the start of a strong rally.
At the same time, it is
evident that the bullion market is placing emphasis on the 20-day MA (the
black line on the following chart), in that this MA has regularly acted as
support and resistance over the past several weeks. For example, Tuesday's
downward spike in the gold price ended at the 20-day MA. As a consequence,
a daily close below the 20-day MA (let's say, below $1340 over the
reminder of this week) would warn that an upside breakout was not
imminent.
More evidence of gold market manipulation
According to the article posted
HERE, traders working for large banks have been manipulating the gold
market for many years. In other breaking news, the Earth is round and the
sun sets in the west.
The gist of the above-linked article is that
the US government has taken legal action against some banks and individual
traders working for the banks because the banks/traders engaged in
"spoofing". Spoofing involves entering and then quickly removing large
orders to buy or sell with the aim of causing the price to rise or fall
without having to actually buy or sell. The idea is to influence the
actions of other traders so that the price moves in the desired direction.
It isn't a new idea. For example, Jesse Livermore regularly used similar
tactics during the first 2 decades of the 1900s. In more general terms,
the practice involves making other traders think that you are a large
buyer when actually you want to sell or that you are a large seller when
actually you want to buy. The main difference today is that things happen
far more quickly due to computer-facilitated trading.
There is
nothing inherently wrong with spoofing. It is not unethical and should not
be illegal. It is certainly within the rights of commodity exchanges to
set rules prohibiting the practice and to ban or fine the rule-breakers,
but the government should not be involved.
In any case, like all of
the other direct market-manipulation practices that have come to light,
the effects of spoofing are a) extremely short-term (we are talking
seconds or minutes), b) small by the standards of the average retail
trader/investor, and c) in both price directions. Here's a hypothetical
example: The gold price is at $1350 and Trader Joe wants to buy at $1348.
Joe places a large SELL order on the Comex at $1350 or slightly above,
with no intention of having the order filled. Other traders attempt to
jump in front of this order and in doing so knock the price down to $1348,
thus enabling Joe's BUY order to be filled. Joe's sell order is removed
and the price returns to $1350. Potentially, this could all happen within
a few seconds.
The main reason we are mentioning the above article
and the new cases of banks getting caught breaking the rules is to point
out that this information has absolutely nothing to do with the assertion,
popularised by GATA, that the gold market has been subject to a successful
long-term price suppression scheme. There has never been any evidence to
support this assertion and, since it is based on central and private banks
having powers they do not actually possess, there never will be.
The reality is that over the past 20 years the gold price generally has
done what it should have done based on the fundamental backdrop at the
time. Also, the senior members of the major central banks no longer care
what happens to the gold price (in the 1970s they cared, but they don't
care anymore) and even if they did care they do not have the power to
alter important gold-price trends via direct manipulation. The actions of
the major central banks do, of course, indirectly affect the gold price by
affecting confidence in the official money, but in this regard the actions
are more often than not gold-price supportive. That's why the gold price
is in a multi-generational upward trend relative to commodities in
general.
Gold Stocks
It looked like the Gold Miners ETF
(GDX) was going to break above resistance at $23.00 on Wednesday 18th
April, but the ETF gave up its early gains and again failed to break out.
GDX ended Wednesday's session right at resistance, with the US$ gold
price about $10 below resistance. The market therefore is close to an
upside breakout, but the proximity to resistance also makes it vulnerable
to a price reversal.
We think it's a toss-up as to whether an
upside breakout happens now (that is, within the next few days) or happens
a few weeks from now following some intervening weakness.
As time goes by it is becoming less likely, but the risk of a
trend-ending plunge in the gold-mining indices and ETFs to new 12-month
lows will remain until the gold price breaks above resistance in the
low-$1360s.
The Currency Market
It's
interesting that when stock market volatility suddenly picked up in
late-January, the currency market became much less volatile. At least as
measured by the performance of the Dollar Index (DX), the currency market
has been unusually stable since the late-January stock market peak and
volatility surge.
Over the past seven trading days the DX has
barely moved at all. It remains close to the middle of the narrow
multi-month range from which it must escape to signal the direction of its
next short-term trend. The anticipation of an eventual downside breakout
appears to be building, at least in the minds of commodity speculators,
but until there is a daily close below 88.5 there will be a risk of an
upside breakout.
In our opinion, the major currencies with the best short-term
risk/reward ratios are the Australian Dollar and the Swiss Franc.
Updates on Stock Selections
Notes: 1) To review the complete list of current TSI stock selections, logon at
http://www.speculative-investor.com/new/market_logon.asp
and then click on "Stock Selections" in the menu. When at the Stock
Selections page, click on a stock's symbol to bring-up an archive of
our comments on the stock in question. 2) The Small Stock Watch List is
located at http://www.speculative-investor.com/new/smallstockwatch.html
![]() Cassini
Resources (CZI.AX). Shares: 276M. Recent price: A$0.067. Cash: about A$2M.
Current enterprise value: about A$17M
Cassini
Resources (CZI.AX). Shares: 276M. Recent price: A$0.067. Cash: about A$2M.
Current enterprise value: about A$17M
With the nickel
price having moved up to US$6.90/pound and with the stock price of Cassini
Resources (CZI.AX) having dropped back to a long-term trend-line (see
chart below), it's time for us to revisit the stock. CZI is a member of
the Small Stocks Watch List (SSWL) and is a leveraged play on nickel via
its JV with mid-tier miner Oz Minerals (OZL.AX) at the West Musgrave
project in WA.
Due to the rise in the nickel price over the past several months, the
West Musgrave project looks economically viable. Moreover, OZL seems to be
bullish on this project's prospects. Therefore, we think that the downward
drift by CZI's stock price to trend-line support has created a speculative
buying opportunity.
We most recently wrote about the CZI-OZL joint
venture and the economics of the West Musgrave project in the 15th
November 2017 Interim Update. For ease of reference, here is a copy of
that write-up:
"CZI's flagship asset is the West Musgrave
Project (WMP) in Western Australia, a project that contains a large,
low-grade nickel-copper resource. The WMP is a JV between CZI and Oz
Minerals (OZL.AX), a mid-tier copper producer. OZL can earn up to 70% of
the project by spending A$36M in stages and advancing the project to the
point where there is a completed FS.
On Tuesday of this week CZI
reported the results of a Scoping Study (that is, a PEA) for the WMP. The
Scoping Study (SS) was done by OZL as part of its earn-in obligations.
The SS is based on the development of a mine with average annual
production of 44M-55M pounds of nickel plus 55M-66M pounds of copper plus
1.5M-2.2M pounds of cobalt over an initial mine life of 8 years. The
pre-production capex is estimated to be A$730M-$800M.
The headline
economics indicated in the SS look good. In particular, the post-tax IRR
is estimated to be 20%-25%. These headline numbers prompted a flurry of
buying in the immediate aftermath of the news and pushed CZI's stock price
up 25% to A$0.125, but when a closer look was taken at the SS details it
became apparent that the robust IRR was based on very aggressive
assumptions and the stock sold off.
The 20%-25% IRR was calculated
assuming a copper price of US$2.95/pound, a nickel price of US$7.13/pound
and an A$/US$ rate of 0.74. The copper price assumption is justifiable
given that the current price is around US$3.00, but the nickel price
assumption is unreasonably high given that the price is currently around
US$5.20 and hasn't been above $7.00 since 2014. Also, the assumed A$/US$
rate is unreasonably low given that the current rate is around 0.76 (the
lower the assumed A$/US$ rate, the better the economics will appear to
be).
Unfortunately, CZI hasn't yet provided information on what
the economics would be under more conservative/realistic price
assumptions, but we suspect that the project would look economically
marginal at today's metal prices and exchange rate.
That's the bad
news. The good news is that OZL has committed to continue with its
earn-in. The larger company could have 'pulled the plug' having spent only
A$3M, but it has opted to spend another $19M over the next 18 months to
boost its stake in the WMP to 51%. It wouldn't be doing this if it didn't
believe that the WMP could be developed into a profitable mining
operation.
Given that the forecast production costs are low (bottom
1/3 for nickel and bottom 1/4 for copper), the marginal-economics problem
is most likely caused by the pre-production capex being too high relative
to the mine size or mine life. It may be possible to resolve this problem
by expanding the mineable resource.
The bottom line is that CZI is
still an interesting speculation. The keys are that its market cap is very
low and that it is being free-carried by OZL to the point where a decision
is made to build a mine."
Chart Sources
Charts appearing in today's commentary
are courtesy of:
http://stockcharts.com/index.html
http://www.barchart.com/
http://bigcharts.marketwatch.com/
![]()