|
- Interim Update 18th August 2010
Copyright
Reminder
The commentaries that appear at TSI
may not be distributed, in full or in part, without our written permission.
In particular, please note that the posting of extracts from TSI commentaries
at other web sites or providing links to TSI commentaries at other web
sites (for example, at discussion boards) without our written permission
is prohibited.
We reserve the right to immediately
terminate the subscription of any TSI subscriber who distributes the TSI
commentaries without our written permission.
Quick comment on Treasury Bonds
In
the latest Weekly Update we speculated that "the bond market's apparent
inability to appreciate the eventual effects of today's policies could
stem from the fact that a lot of the demand for long-term bonds comes
from short-term traders". Evidence to support the idea that short-term
traders are now having a big effect on the market for long-dated US
government bonds is contained in the following excerpt from Doug
Noland's latest Credit Bubble Bulletin:
"August 11 -- Financial
Times (Sam Jones): "Hedge fund trading of US government bonds has
surged in 2010, according to a comprehensive new survey of fixed income
investors. Hedge fund managers now account for a fifth of all
trading volume in the $10,000bn US Treasury bond market, up from just
3% in 2009, according to Greenwich Associates.""
That is, hedge fund trading has gone from 3% to 20% of the T-Bond
market over the past 12 months. There's a good chance that a lot of
these hedge funds are trend-followers and have become increasingly
'long' as bond prices have moved higher.
We think the government bond market is a collapse waiting to happen,
but we are currently not betting on such an outcome (and nor have we at
any time over the past five years). This is a market we prefer to leave
alone, because unlike the gold market the 'authorities' do have a
realistic chance of making the bond market do what they want it to do.
The reason is that in order to prop-up the price of something all you
need is money, and money is something 'they' have an unlimited supply
of.
The T-Bond market will eventually collapse, but we won't place a bet
against this market until we see evidence that the Fed and the
government are losing their ability to support it. And by the way, we
are not suggesting that the current low levels of Treasury yields are
solely, or even primarily, the result of manipulation. Right now,
inflation expectations are low, the economy is clearly weakening, and
trend-following speculators are playing a significant role.
The Stock Market
Approaching the point of recognition?
US economic data have been deteriorating over the past three months and
are likely to deteriorate further over the next three months, but
that's not necessarily a problem for the stock market. The stock market
always attempts to discount the future, which means that economic
weakness is only ever a threat when it hasn't been discounted. This is
why the stock market often makes a sustainable up-turn months before
the economic data begin to show any signs of improvement. In such cases
it isn't so much that the stock market is able to presciently look
beyond the current weakness to the brighter days that lie well into the
future, it's that a lot of additional economic weakness has already
been factored into current stock prices. So, more evidence that the US
economy is deteriorating will only be a problem for the stock market if
the market is expecting a rosier scenario. Assuming that the economic
numbers are going to get worse, the relevant question with regard to
the stock market's likely reaction is therefore: how much additional
economic weakness is the market expecting?
That's a difficult question to answer, because it is only at those
times when sentiment indicators reveal extreme optimism or extreme
pessimism that the market's short-term expectations are readily
apparent. Right now, sentiment indicators are generally in neutral
territory.
In conference calls with analysts and investors over the past month,
the managements of many large US corporations have been very cautious
in their guidance. This has undoubtedly helped to lower the stock
market's expectations. There's a big difference, however, from coming
around to the belief that future growth will be modest and realising
that future growth will be nonexistent or negative.
Our guess is that the market is ready for a period of slow growth, but
not for a period of economic contraction. After all, a lot of the talk
in the mainstream financial media now revolves around what the Fed can
or will do to keep the economic recovery going. There is rarely any
acknowledgement of the possibility that the economy has already dipped
back into recession or never emerged from the recession of 2007-2009.
In general, weakness in the economic data is presented as if it were
either an anomaly or restricted to real estate, and there is much
discussion about a "jobless recovery" (as if it were actually possible
for the economy to make a genuine recovery without bringing about an
improvement in the employment scene). We therefore think that if the
economic data started pointing to a recession, the stock market would
quickly lose at least 10% of its value.
As noted at the start of this discussion, further deterioration of the
economic numbers is likely over the next three months. It is impossible
to know if there will be sufficient deterioration to make a critical
mass of stock market participants believe that the US economy is in, or
headed towards, a recession, but in our opinion the risk of reaching
such a point of recognition is high.
The mismatch between interest rates and stock prices
We mentioned above that the stock market could be approaching a point
of recognition -- in this instance, the point where the market stops
discounting additional recovery and starts discounting recession. The
bond market, however, seems to have reached this point a few months
ago, which means that there is presently something of an expectation
mismatch between the stock and bond markets.
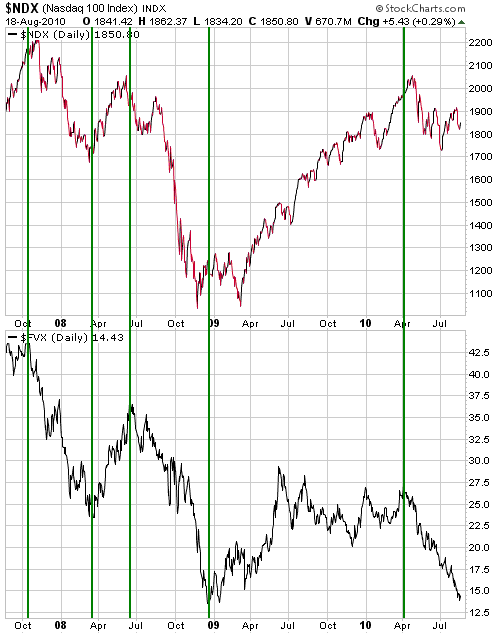
The expectation mismatch is illustrated by the following chart
comparison of the NASDAQ100 Index (NDX) and the 5-year T-Note yield
(FVX). We included the same chart in the 2nd August Weekly Update to
make the point that even though the NDX was rebounding, the continuing
decline in the 5-year yield suggested that the stock market's
intermediate-term trend was still down. Since then the NDX hasn't done
much, but the 5-year yield has stayed on its downward path and is now
as low as it was at the recession trough in early 2009.
When inflation expectations are low, interest rates tend to decline in
anticipation of economic weakness. So, either the bond market is
completely wrong or the stock market will soon make a catch-up move to
the downside.
Current Market Situation
In the latest Weekly Update we noted that after only four down-days the
NASDAQ Composite Index's McClellan Oscillator (MO) was already low
enough to suggest that a rebound was likely to alleviate the 'oversold'
condition. We also noted that a short rebound at this time would be
consistent with the "Presidential Cycle" Model.
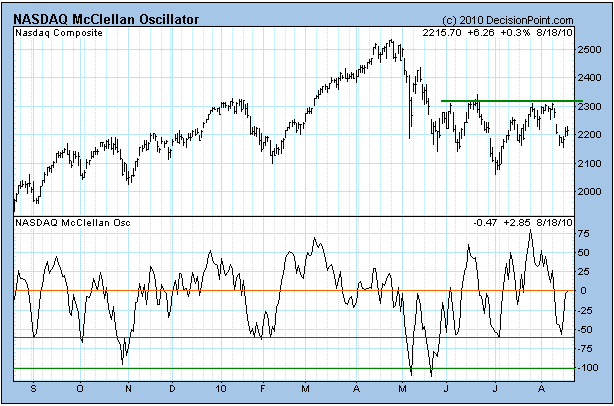
A rebound has occurred, and as illustrated by the following chart it
has been of sufficient strength to push the NASDAQ's MO back to zero
(the neutral level). In other words, the market has worked off its
'oversold' condition.
Although there is no
requirement for it to do so, the market could maintain an upward bias
into next week. However, the Presidential Cycle Model tells us that a
substantial 1-2 month decline should be underway by the end of next
week.
That the market has been closely tracking the Presidential Cycle Model
since the beginning of the year doesn't guarantee that it will continue
to do so. It is important, therefore, to consider what would have to
happen to indicate an alternative outcome. With this in mind, we point
out that a solid close above 2320 by the NASDAQ within the next two
weeks would be an important divergence from the Model we've been using.
Moving along, everybody knows that the homebuilding sector of the US
economy has been very weak. As a result, nobody should be surprised
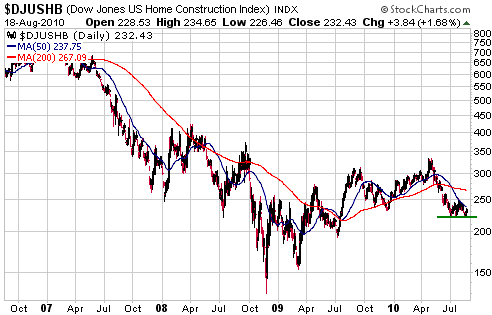
that the Dow Jones US Home Construction Index (DJUSHB) has a
bearish-looking chart (see below).
The point we want to make is that the fundamentally and technically
weakest sector of the stock market will very likely continue its
downside leadership, which means that a move to a new low for the year
by the DJUSHB could be used as an early warning sign that the broad
market was about to make a big move to the downside. By the same token,
a failure by the DJUSHB to break below its recent low of 220 in the
near future would cast doubt on our short-term bearish view.
Gold and
the Dollar
Gold
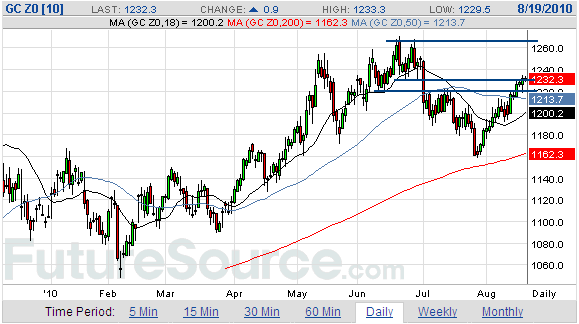
December gold has nudged above resistance at $1220-$1230, but unless it
also breaks above resistance in the low-$1260s we think it will be
prudent to operate on the basis that at least 1-3 months of additional
'corrective' activity will occur before the next major advance gets
underway.
Gold Stocks
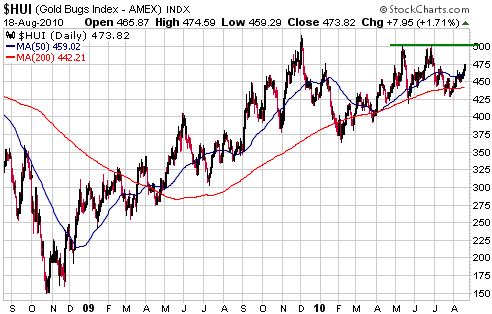
The combination of gold's move above resistance at $1220-$1230 and some
strength in the broad stock market has enabled the HUI to exceed
resistance at 470. The next resistance of significance lies about 5%
higher -- at the big round number (500).
We certainly can't rule out the possibility that the HUI is about to
rise to 500, or even that it is about to make a major break to new
all-time highs (above 520), but with the broad stock market probably
within a few days of commencing a large decline and with gold now
extended to the upside on a short-term basis we certainly wouldn't bet
on it. The most likely outcome is that the HUI peaks below 500 within
the next three trading days.
Note that if the HUI does manage to rise to 500 within the next few
days it will be as 'overbought' as it was at the May and June highs, so
the stage will still be set for a peak of some description. We point
out, though, that triple tops usually don't hold (they usually lead to
upside breakouts), so if the HUI rises to 500 at any time over the next
couple of weeks then we will definitely have to re-think, and probably
have to revise, our forecast for an October-November correction low. To
put it another way, if our favoured scenario (a decline to an
October-November correction low) is going to play out then the peak of
the current HUI advance should be comfortably below 500.
Unlike the HUI, Royal
Gold (RGLD) has already tested its February low. RGLD tends to hold up
relatively well during the final phase of an intermediate-term decline
in the gold sector and then lead to the upside during the first phase
of the ensuing intermediate-term rally. It is therefore possible that
RGLD will do no worse from here than test its July low, even if our
favoured scenario plays out.
Currency Market Update
The Dollar Index rebounded sharply last week as the stock market fell,
and then pulled back over the first three days of this week as the
stock market rebounded. We expect that the Dollar Index will continue
to move inversely to the stock market over the next couple of months,
meaning that we would expect a sharp stock market decline to an October
low to be accompanied by a strong advance in the US$.
Update
on Stock Selections
(Notes: 1) To review the complete list of current TSI stock selections, logon at http://www.speculative-investor.com/new/market_logon.asp
and then click on "Stock Selections" in the menu. When at the Stock
Selections page, click on a stock's symbol to bring-up an archive of
our comments on the stock in question. 2) The Small Stock Watch List is
located at http://www.speculative-investor.com/new/smallstockwatch.html)
 New stock selection: Sulliden Gold (TSX: SUE). Shares: 156M issued, 204M fully diluted. Recent price: C$0.69 New stock selection: Sulliden Gold (TSX: SUE). Shares: 156M issued, 204M fully diluted. Recent price: C$0.69
SUE is developing the Shahuindo gold project in Peru. Shahuindo is
located about 80 kms south of the 2M-oz/yr Yanacocha gold mine operated
by Newmont.
A Preliminary Economic Assessment (PEA) completed in February of 2010
determined that Shahuindo could be developed into a mine that produces
95K ounces of gold per year. Importantly, it estimated that Shahuindo
would have an Internal Rate of Return (IRR) of 55% and a Net present
Value (at an 8% discount rate) of US$165M, assuming a gold price of
US$975/ounce. At $1140/oz the estimated NPV rises to US$240M, which
equates to about C$1.40/share if we assume a share count of 180M. In
other words, SUE is potentially worth twice its current stock price
with gold about $80/oz below its current level.
Although SUE offers reasonable value based on the cash flow that it
will POTENTIALLY be able to generate from Shahuindo, it doesn't look
particularly cheap based on the size of its in-ground resource. At
least, it doesn't look cheap compared to many of the other
exploration-stage gold stocks that we track. For example, we know of
several juniors that are now being valued by the stock market at less
than US$20/oz, compared to about US$70/oz for SUE's 1.4M-ounce resource
(1.1M ounces Indicated + 0.3M ounces Inferred).
We think that $70/oz for SUE's current in-ground resource is an
attractive deal, however, due to the simplicity (read: relatively low
risk) of its project. Of particular note, the PEA is based on using an
open-pit, heap-leach mining process to extract gold from only the
1.1M-ounce oxide portion of the overall deposit.
In addition to the simplicity and low-cost nature of the forecast
mining process, SUE's speculative merit is enhanced by the speed with
which it will be progressing the Shahuindo project and the likelihood
of significant resource growth. Regarding the expected rate of
progress, we note that the company jumped straight from the PEA stage
to the Feasibility Stage and is planning to have a completed
Feasibility Study (FS) by year-end. Regarding the potential for
significant resource growth, in parallel with the engineering work
related to the FS the company will be carrying out a 30,000m drilling
program. This drilling program should add to the resource and ensure
good news-flow over the months ahead.
Also worth mentioning is that SUE has about C$14M of net cash (C$17M
cash minus $3M debt), which is more than enough to finance its
aggressive work program over the next 6 months.
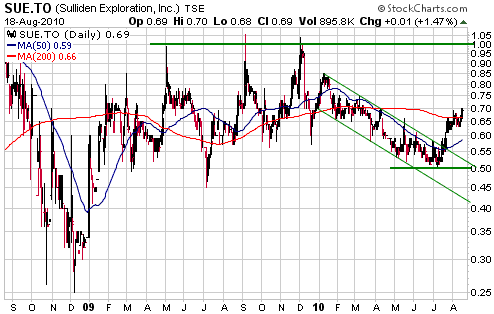
Turning to the price chart (see below), SUE peaked at just above C$1
last December and probably bottomed at C$0.50 in July. If there is a
sector-wide decline to an October-November low then SUE could test its
July low, but we doubt that it will do much worse than that.
The short-term upside potential is probably limited by resistance at
C$1.00, so the short-term risk/reward isn't enticing (upside to $1.00,
downside to $0.50). However, on an intermediate-term basis the
risk/reward looks good. Our intermediate-term valuation-based upside
target is C$1.50 assuming a gold price of $1100-$1200, and would be
higher at a higher gold price.
For an exploration-stage junior, SUE's stock is reasonably liquid. For
example, it has traded an average of 280,000 shares per day over the
past three months and traded 900,000 shares on Wednesday 18th August.
Our suggestion is to take an initial position in the high-C$0.60s with
the aim of adding on weakness over the next three months.
 Gryphon Gold (TSX: GGN). Shares: 88M issued, 99M fully diluted. Recent price: C$0.11 Gryphon Gold (TSX: GGN). Shares: 88M issued, 99M fully diluted. Recent price: C$0.11
In February, GGN entered into a 50/50 joint venture with Sage Gold
(TSXV: SGX) to develop GGN's Borealis gold project in Nevada. The JV
was terminated by mutual agreement at the beginning of this week.
When the JV was established in February we didn't think it added any
value. The reason is that Sage, like GGN, is a very small company with
minimal financial resources, so GGN's decision to team up with SGX
didn't help to address the all-important construction-financing
obstacle and progress Borealis through to production. We therefore
don't think that the termination of the JV has removed any value.
Actually, an argument could be made that the JV deal removed some value
in that it caused GGN's share of the Borealis project to drop from 100%
to 50%, and that the deal's termination has added this value back.
The Borealis project has a 2.5M-ounce in-ground resource, and at GGN's
current stock price the resource is being valued at an incredibly low
$5/oz. However, this gold resource is likely to remain 'dirt cheap'
until something is achieved on the financing front.
GGN will be no better than a 'hold' until financing is in place or a JV deal is done with a stronger partner.
Chart Sources
Charts appearing in today's commentary
are courtesy of:
http://stockcharts.com/index.html
http://www.futuresource.com/
http://www.decisionpoint.com/

|

