|
- Interim Update
19th February 2014
Copyright
Reminder
The commentaries that appear at TSI
may not be distributed, in full or in part, without our written permission.
In particular, please note that the posting of extracts from TSI commentaries
at other web sites or providing links to TSI commentaries at other web
sites (for example, at discussion boards) without our written permission
is prohibited.
We reserve the right to immediately
terminate the subscription of any TSI subscriber who distributes the TSI
commentaries without our written permission.
Commodities
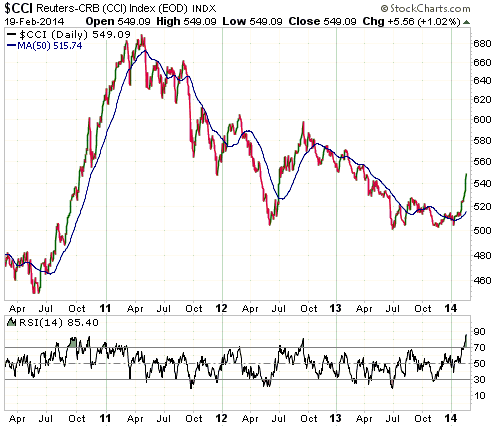
The Continuous Commodity Index (CCI)
We mentioned a couple of weeks ago that the CCI's price action had
provided evidence of an important upward trend reversal. It has
since moved sharply higher, further increasing the probability that
a reversal of at least intermediate-term significance has happened.
However, the RSI shown at the bottom of the following chart
indicates that on a short-term basis the CCI is now more
'overbought' than it has been at any time over the past three years.
This means that the new upward trend is in need of a pause.
A routine correction would take the CCI back to the vicinity of its
50-day MA. Although this MA is well below the current market price,
it is rising and will possibly meet the market price in the 520s at
some point over the next few weeks.
Oil
The oil price broke out to the downside in early January, but then
quickly reversed upward. This established a false downside breakout
-- a bullish signal. It has just broken above resistance defined by
its late-December high and is trading at its highest price since
early-October. The break above the December high suggests a
short-term target of around $109.
However, oil is now short-term 'overbought' and at risk of
establishing a false upside breakout. A daily close below $99.50
would indicate that the recent break above the December high was
false (a 'head fake').

Unless advised otherwise, our short-term oil market outlook will
shift to "bearish" if the oil price closes below $99.50 or rises to
$107.
The Stock Market
As evidenced by the following daily chart, the stock market
remains remarkably sanguine about the prospects for European banks. The chart
shows that the EURO STOXX Banks Index (SX7E) is presently not far below the
multi-year high reached last month.
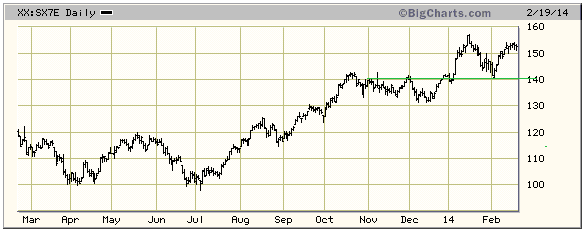
The stock market is wrong, but we will resist getting very worried about the
beginning of the next phase of the euro-zone's slow-motion crisis until
preliminary signs of a trend reversal appear in SX7E's price action. We would
currently view a break below 140 as such a sign.
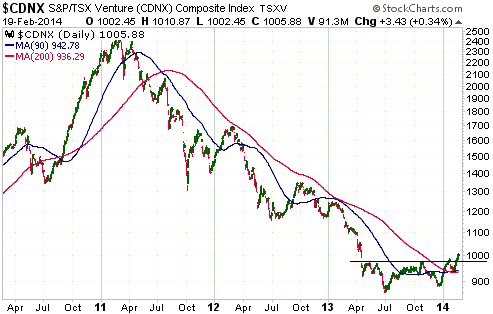
Recent price action has provided more evidence of a major upward trend reversal
in the TSX Venture Exchange Composite Index (CDNX), a proxy for junior Canadian
resource-oriented stocks. We are referring to the fact that the CDNX's pullback
from its January high found support exactly where it should have (at the 90-day
MA) and has been followed by a rise to a new multi-month high (see chart below).
The CDNX's upward reversal is consistent with the reversal in the Continuous
Commodity Index mentioned above.
Gold and the Dollar
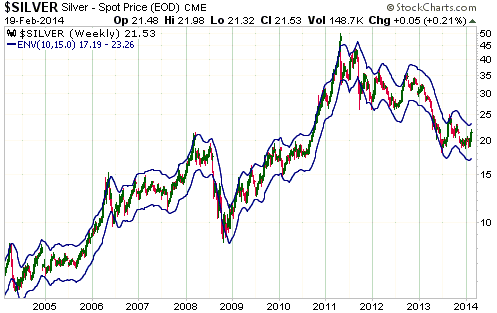
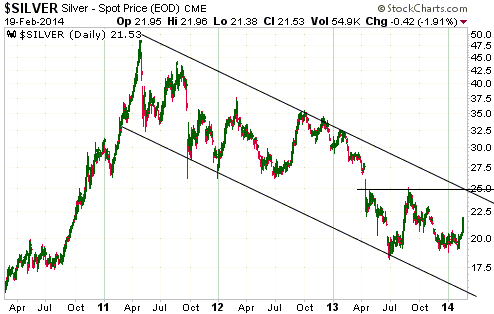
Silver
In the latest Weekly Update, we said: "Silver is likely to trade at least as
high as $23 and could trade as high as $24-$25 within the next three months."
Here's where these numbers came from:
The following weekly silver chart shows a 10WMA/15% moving-average envelope,
meaning that it shows a 15% envelope around the 10-week moving average. Except
for times when the silver market is crashing (e.g. H1-2013 and H2-2008) and
times when a silver mania is in progress (e.g. H1-2011 and H1-2006), short-term
trends never extend significantly beyond this envelope or remain outside this
envelope for long. This year there is very little chance of a crash, because a
crash occurred last year, and very little chance of a mania, because manias only
ever occur during the late stages of multi-year advances, so it is reasonable to
expect that the 2014 rallies and downturns in the silver market will be limited
by the 10/15 envelope.
Additionally, after clear-cut price-related evidence of a short-term upward
trend has been received, as is the case right now, the rally usually continues
until the top of the 10/15 MA envelope has been reached, with short-lived spikes
above the top of the envelope being common. The top of the envelope, which is
just above $23 and rising, therefore defines the current rally's MINIMUM upside
target. Hence our comment that silver is likely to trade at least as high as $23
in the short term.
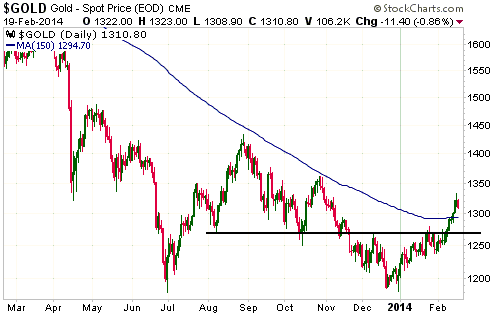
The following daily silver chart shows that the $24.50-$25.00 range coincides
with the top of a long-term channel and intermediate-term lateral resistance.
This confluence of important resistance could act as both a magnet and an
obstacle over the next few months. It is an obvious target for short-term
speculators to shoot for, but there is little chance of it being breached on the
first attempt. Hence our comment that silver could trade as high as $24-$25 in
the short term.
Gold
The gold market has done nothing of significance so far this week. The market is
a little 'overbought' on a short-term basis and possibly made a 1-3 week top
when it traded in the $1330s on Tuesday, but it's also possible that the price
will move up to around $1350 before some sort of corrective activity begins.
There's no way of knowing.
After a 1-3 week consolidation gets underway, the 150-day MA (currently around
$1295) will be a likely target and lateral support in the $1270s will be a
worst-case target.
Gold Stocks
Setting expectations based on the historical record
Recent price action makes it clear that the gold-mining sector of the stock
market made a major bottom late last year. It is therefore time for us to
revisit our chart comparisons with the cyclical declines that bottomed in 1970,
1976 and 2000 in an effort to find clues as to what the future holds in store.
The difference this time around is that whereas we previously did our
comparisons by lining up the peak of September-2011 with earlier cyclical peaks,
we are now lining up the December-2013 bottom with earlier cyclical bottoms.
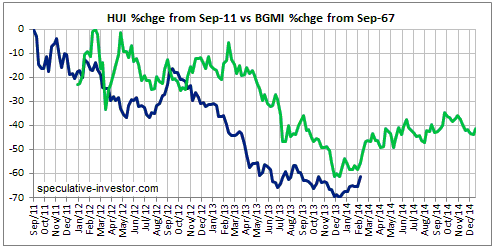
Our first chart compares the Barrons Gold Mining Index (BGMI) of 1967-1970 with
the present-day HUI. In this case, the HUI's December-2013 bottom has been lined
up with the BGMI's January-1970 bottom.
If today's HUI follows a similar path to the one followed by the BGMI after its
January-1970 bottom, it will trend upward throughout this year but almost all
2014's gains will be in place by June. The highest price reached during the
first half of this year would likely be in the low-300s.
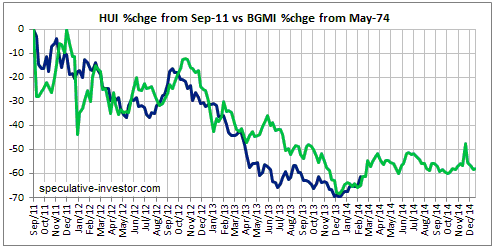
Our second chart compares the BGMI of 1974-1977 with the present-day HUI. In
this case, the HUI's December-2013 bottom has been lined up with the BGMI's
September-1976 bottom.
If today's HUI follows a similar path to the one followed by the BGMI after its
September-1976 bottom, then almost all of this year's gains will be in place by
April. Again, the highest price reached during the first half of this year would
likely be in the low-300s.
Our third chart compares the HUI of 1998-2001 with the present-day HUI. In this
case, the HUI's December-2013 bottom has been lined up with its November-2000
bottom.
If the HUI follows a similar path this year to the one it followed after its
November-2000 bottom, then all of this year's gains will occur during the first
half and the high will be around 400.
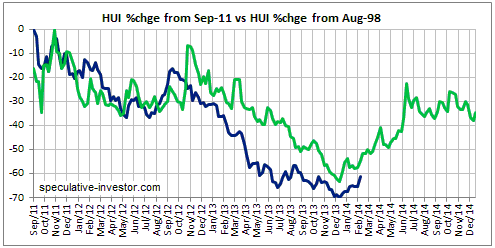
The common theme in the above three chart comparisons is that the gold sector
will be much stronger during the first half of 2014 than during the second half
of 2014. The comparison with the 2000 bottom suggests potential upside to 400,
but the comparisons with the 1970 and 1976 bottoms make more sense to us. This
is because the 1970 and 1976 bottoms occurred within a long-term bull market,
whereas the 2000 bottom occurred at the end of a long-term bear market. Anyhow,
it would be reasonable to view 400 as a maximum upside target and 300 as a
likely upside target.
A logical implication of the above is that you should take advantage of
broad-based strength during the first half of this year to cull your portfolio
of any stocks that you do not want as long-term holdings.
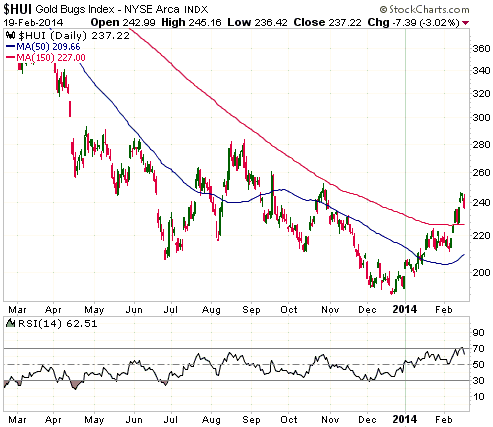
Current Market Situation
The HUI is in a similar situation to gold. First, a 1-3 week consolidation might
have commenced, but the evidence is not yet conclusive. Second, the 150-day MA
(currently in the mid-220s) will be a likely target after a consolidation gets
underway.
Regardless of whether or not it has already begun, the next consolidation is
likely to accomplish two things: As noted above, it will probably take the HUI
back to the vicinity of its 150-day MA. It will also probably take the HUI's
daily RSI, which is shown at the bottom of the following chart, down to around
50.
Updates
on Stock Selections
Notes: 1) To review the complete list of current TSI stock selections, logon at
http://www.speculative-investor.com/new/market_logon.asp
and then click on "Stock Selections" in the menu. When at the Stock
Selections page, click on a stock's symbol to bring-up an archive of
our comments on the stock in question. 2) The Small Stock Watch List is
located at http://www.speculative-investor.com/new/smallstockwatch.html
 Discussing
a potential future TSI stock selection Discussing
a potential future TSI stock selection
In the 16th December Weekly Update we mentioned five junior gold stocks with the
potential to be future additions to the TSI Stocks List, including brief notes
on each stock explaining why it had speculative merit and why we weren't going
to immediately add it. The stocks were Golden Queen Mining (GQM.TO), Minera IRL
(IRL.TO), Midway Gold (MDW), Papillon Resources (PIR.AX), and Roxgold (ROG.V).
With one exception, all of these stocks have since done well. Of particular
note, GQM.TO has gained about 150% since mid-December.
The one exception is IRL.TO, which has barely moved. This got us thinking that
IRL was worth another look on the basis that it had the potential to make a
catch-up move.
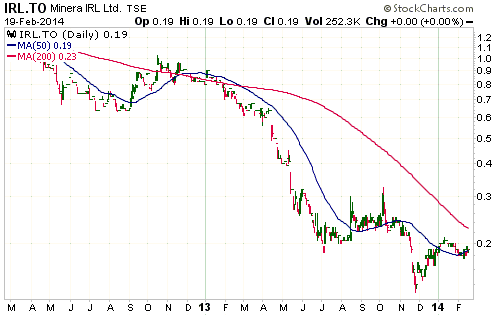
Here's what we wrote about IRL in December:
"IRL has 182M shares outstanding and ended last week at C$0.17. Its two most
important assets are the Don Nicolas gold project in Argentina and the Ollachea
gold project in Peru. Both projects are fully permitted and ready to enter the
mine construction phase. Also, in both cases the planned mine would likely be
profitable at $1250/oz for gold.
IRL's market cap is very low relative to the value of its mining assets.
Financing is the problem. Financing is in place for the Don Nicolas mine
construction, but the company has negative working capital and therefore
urgently needs to raise more money to continue progressing its Ollachea project
and just stay in business.
Despite the fact that IRL is very much on sale, it will probably make sense to
steer clear for now and revisit the stock after the required financing is in
place. Also, at this time the stock is not liquid enough for our liking."
Since that time IRL's share count has blown out to 229M due to the exchange of
some equity for debt.
Given the subsequent upward trend reversal in the gold market, the steadily
improving market for junior gold miners and the fact that IRL's share price
hasn't yet responded to the changed market situation, is IRL now one of the best
candidates for new buying?
We don't think so. Swapping some equity for debt has bought the company some
time, but it hasn't resolved the financing issue and has significantly reduced
the per-share value. The valuation is still very attractive considering the
company's assets, but the per-share value could take another hit depending on
exactly how the financing issue ends up being resolved. Furthermore, until the
financing is 'put to bed', the associated uncertainty could cause the stock to
remain 'dead money'. According to a press release earlier this week, the
financing will not be 'put to bed' until the second quarter of this year.
We wouldn't criticise anyone for taking a small position in IRL below
C$0.20/share, because although the risk is high the valuation-related upside
potential is higher and financing problems will become progressively easier to
solve as the gold sector's upward trend becomes more firmly established.
However, at this stage we much prefer to direct new buying towards companies
that are under no pressure to raise money.
Chart Sources
Charts appearing in today's commentary
are courtesy of:
http://stockcharts.com/index.html
http://bigcharts.marketwatch.com/

|
