![]()
![]()
![]()
![]()
- Interim Update 19th April 2017
Copyright
Reminder
The commentaries that appear at TSI
may not be distributed, in full or in part, without our written permission.
In particular, please note that the posting of extracts from TSI commentaries
at other web sites or providing links to TSI commentaries at other web
sites (for example, at discussion boards) without our written permission
is prohibited.
We reserve the right to immediately
terminate the subscription of any TSI subscriber who distributes the TSI
commentaries without our written permission.
Monetary inflation in
other countries
When it comes to money-supply
data our main focus is on the US and the euro-zone, because changes in the
supplies of the US$ and euro influence global economic trends and most of
our investments to a much greater extent than do changes in the supplies
of any other currencies. However, we don't ignore the monetary landscapes
in other parts of the world and today we'll consider the year-over-year
(YOY) money-supply growth rates in the UK, Australia and Japan.
We'll start with the UK money supply, which happens to be the most
interesting at this time. It's the most interesting because the YOY
percentage change in the measure of UK money supply called Retail M4 has
just hit its lowest level (1.8%) since at least 1991. It isn't every day
that the monetary inflation rate of a major economy makes a multi-decade
low.
On a side note, if a country's central bank provides on-line
monetary data in a way that makes it fairly easy for us to derive the True
Money Supply (TMS) then we will use TMS as our monetary aggregate for that
country, but in some cases the information needed to calculate TMS is not
readily available. The Bank of England (BOE) doesn't provide easy access
to the information needed to calculate TMS, which is why we use Retail M4
as our UK monetary aggregate. Retail M4 in the UK is similar to M2 in the
US.
Here's a chart showing the plunge in the UK's money-supply
growth rate over the past 12 months.
The UK's relatively slow monetary inflation rate is bullish for the
Pound and bearish for the UK stock market in Pound terms.
Turning
to "the land down under", the YOY rate of Australia's TMS growth moved
lower during the bulk of 2015-2016 and bottomed at 5% late last year.
There has since been a rebound, but the current rate is still low compared
to the average of the past 17 years.
The A$'s performance on the FX
market is influenced to a far greater extent by the general
commodity-price trend than by the rate of increase in its supply, but the
rate of increase in the A$ supply makes a big difference to the domestic
economy. The most obvious two consequences of the fast (on average) growth
in A$ supply over the past two decades have been relatively fast "price
inflation" and a real-estate investment bubble.
The decline in the
pace of money-supply growth over the past 2 years could be enough to burst
the real-estate investment bubble.
The rate of growth in Japan's money supply is currently challenging
the 20-year high achieved in early-2014, which means it is slightly above
4% (using the BOJ's M2 as our money-supply aggregate). In other words,
despite the BOJ's extraordinary QE program Japan still has a relatively
low monetary inflation rate.
An implication is that within the
coming two years the Yen is far more likely to trade well above last
year's high than to seriously test its 2015 low.
The Stock Market
The US
We wrote in the latest Weekly Update that this would be an interesting
week, because only a modicum of additional weakness would result in
breaches of support (2322 for the S&P500 (SPX), 1340 for the Russell2000
(RUT)) that point to much lower price levels being attained over the
ensuing two months. By the same token, a failure to break out to the
downside would keep alive the potential for another sharp multi-week
rally.
Both the SPX and the RUT rebounded over the first three days
of this week, so the possibility of another sharp multi-week rally has
been kept alive. However, the rebounds were minor and did not take either
index above its 50-day MA, so the possibility of near-term downside
breakouts followed by declines to much lower price levels also remains
very much alive.
The tension continues to build.
The Emerging Markets Equity ETF (EEM)
Given
the price action in the equity and commodity markets over the past several
weeks, EEM has held up remarkably well. As illustrated below, since
peaking in mid-March it has done no worse than drift down to its 50-day
MA.
Our decision to add the June-2017 EEM $35 put option to the TSI List
in early-March was obviously either premature or completely wrong,
considering that this option was priced at US$0.53 at the time and is now
priced at only US$0.21. We suspect the former and continue to perceive
tradable short-term downside in EEM.
We are therefore adding to the
List a second position in the same option at Wednesday's closing price of
US$0.21. For record purposes the two positions will be viewed as a single
trade with the profit/loss being the average of the profit/loss of each
position.
Gold and the Dollar
Gold
The
gold price has dropped back to the low-$1280s after almost making it to
$1300. To signal a short-term trend reversal it will have to close below
$1260.
The inability of the gold-mining sector to confirm gold's recent break
above its February high warns that although there is not yet any evidence
in gold's price action that its short-term rally is over, a downward
reversal might be near. At the same time, gold's "true fundamentals" have
collectively become bullish and will likely become more so if the SPX soon
breaks below its March low. If the fundamental backdrop stays gold-bullish
it will reduce the downside risk in the gold price.
This is a good
time to reiterate that gold generally responds to fundamental shifts with
no lead or lag, a characteristic that can be most easily illustrated with
a chart comparing the gold price and the bond/dollar ratio (the T-Bond
price divided by the Dollar Index). For example, the following chart shows
that the gold price and the bond/dollar ratio turned upward together in
December-2016 and downward together in July-2016. The fundamentals (as
indicated on our chart by the bond/dollar ratio) turned upward ahead of
the gold price in late-2015, but only by about one month. Furthermore,
even the improvement in the gold price over the past 1.5 weeks went
hand-in-hand with an improvement in the fundamentals.
One
implication is that changes in the fundamentals that have already happened
do a better job of explaining previous changes in the gold price than
predicting future changes in the gold price. Another implication is that
the gold price usually doesn't do a good job of predicting the future
fundamental backdrop.
However, it is still helpful to know whether
or not a sizable move in the gold price has fundamental support. It is
also helpful to understand what will have to change in the future to make
the fundamental backdrop more or less bullish for gold.
Gold Stocks
Current
Market Situation
Last week the HUI broke above the top of a
2-week consolidation pattern and moved quickly up to its 200-day MA, but
over the first three days of this week it retraced last week's gain and
has reached a decision point. If it holds near its current level then the
pullback of the past few days could reasonably be interpreted as a
successful test of the preceding week's upside breakout, but a daily close
below 202 (just two points below Wednesday's close) would mark last week's
performance as the completion of a counter-trend rebound within an
on-going intermediate-term decline.
The risk of a decline to below
the December-2016 low (but not the January-2016 low) remains.
The gold-mining ETF breakdown
In the latest Weekly Update we mentioned that GDXJ was changing its
methodology to enable the inclusion in the ETF of larger-capitalisation
stocks. This change has been prompted by the difficulty being experienced
by authorised participants (APs) in GDXJ and JNUG (a 3X leveraged play on
GDXJ) due to the combination of high demand for the ETFs and insufficient
liquidity in the ETF holdings to accommodate the high ETF demand.
Here's how an ETF works: First, when the ETF trades at a discount to its
net asset value (NAV) there is an opportunity for APs to obtain an
arbitrage profit by redeeming ETF shares for baskets of the ETF holdings
(component stocks in the case of an equity ETF), after which the holdings
will usually be sold on the market. This puts upward pressure on the ETF's
market price and downward pressure on the prices of the ETF's components,
thus bringing the ETF's market price into line with its NAV. Second, when
the ETF trades at a premium to its NAV there is an opportunity for APs to
obtain an arbitrage profit by purchasing baskets of the ETF components and
providing these baskets to the ETF manager in exchange for new ETF shares,
after which the ETF shares will usually be sold on the market. This puts
downward pressure on the ETF's market price and upward pressure on the
prices of the ETF's components, thus bringing the ETF price into line with
its NAV.
The above-described process works perfectly as long as the
ETF's holdings are sufficiently liquid to enable the APs to quickly
buy/sell them in response to changes in demand for the ETF shares. A
problem arises, however, when the APs are unable to trade the ETF
components in sufficient volume to accommodate changes in the demand for
the ETF shares.
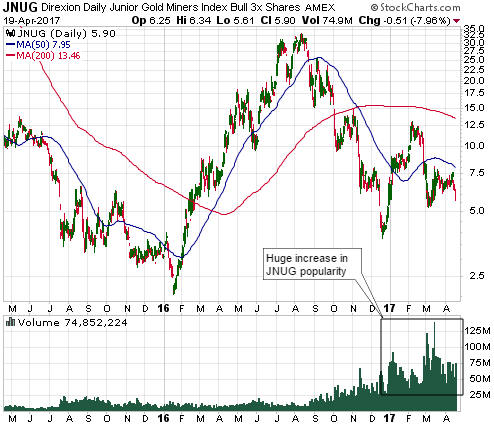
Such a problem has arisen with GDXJ, although the
problem is mainly due to a surge in the demand for a GDXJ derivative
called JNUG. Specifically, large shifts in the demand for JNUG shares over
the past several months (as evidenced by the volume increase shown at the
bottom of the following daily chart) have caused large shifts in the
demand for GDXJ shares, which, in turn, have caused large shifts in the
demand for GDXJ's component stocks, many of which are too illiquid to cope
with the change. Hence the decision to populate GDXJ with stocks that have
higher market caps and greater trading liquidity.
On a related matter, the manager of JNUG announced after the close of
trading last Thursday that, effective immediately, daily JNUG creation
orders will be temporarily suspended. This means that until further notice
it will not be possible for APs to prompt the creation of new JNUG shares
when the ETF trades at a premium to its NAV.
To end this discussion
we firstly note the following four implications of the above-mentioned
GDXJ and JNUG changes:
1) Rather than being a junior-focused
gold-mining ETF, GDXJ will be more of a mid-tier-focused gold-mining ETF.
That is, GDXJ will be more like GDX.
2) There will be temporary
GDXJ-related upward pressure on the mid-tier gold stocks that are being
added to GDXJ and temporary downward pressure on the smaller GDXJ
components that are being sold by the ETF to make way for the more-liquid
stocks. For example, the bulk of the weakness in Premier Gold (PG.TO) over
the past three days was probably due to selling by GDXJ.
3) It
will temporarily be possible for JNUG to trade at a large premium to its
NAV.
4) The fact that the changes have been forced by aggressive
buying of gold-mining bull funds means that there is a lot more optimism
about the prospects for gold-mining stocks than most analysts believe.
This should be viewed as a negative, because it implies that the
gold-mining sector is missing the scepticism that is generally present in
the early stages of major rallies.
We also point out that the
liquidity problem that has recently been encountered by a couple of junior
gold-mining ETFs, that is, the problem caused by an ETF having components
that are much less popular/liquid than the ETF, could eventually be
experienced by many other ETFs. In fact, this is the potentially-fatal
weakness in the entire ETF concept and a weakness that very few market
participants are aware of or care about.
The Currency
Market
The Dollar Index
The Dollar Index pulled back during the first half of this week but
remains comfortably above trend-defining support at 98.6. It needs to
either close below 98.6 or above 101.3 to generate a meaningful signal.
The British Pound
Theresa May,
the UK's Prime Minister and the leader of the Tory Party, has called for
an early general election. As per the standard 5-year term an election is
not required until 2020, but to strengthen her position in the Brexit
negotiations and take advantage of the main opposition party's
unpopularity she has sought and obtained parliamentary approval for the
country go to the polls on 8th June of this year.
The Pound rose
sharply on the FX market in reaction to this surprising news. At a
fundamental level the news is neutral for the Pound, but the huge
speculative net-short position in Pound futures had left the market
vulnerable to a short squeeze. All that was needed was a catalyst.
We have been anticipating an 8-year cycle low for the Pound. Based on the
historical record the most likely time for the cycle low was the first
quarter of this year, although it would not be unprecedented for the major
low to occur as late as June.
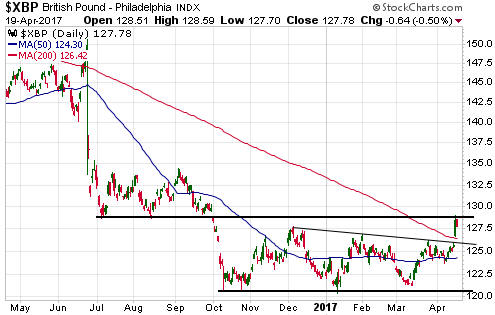
The price action over the first three
days of this week broke the Pound upward from a 6-month trading range and
increased the probability that the 8-year cycle low is in place. However,
for the breakout to be genuine it must be confirmed by the weekly close. A
weekly close above 127.5 would indicate that the breakout was probably
sustainable while a weekly close above 129 would seal the deal.
We
will revisit the Pound's 8-year cycle in the coming Weekly Update.
The Australian Dollar (A$)
The
A$ is testing support at 75.0. A solid breach of this short-term support
would suggest that a decline to intermediate-term support at 71.5-72.0 was
underway.
Due mainly to our short-term bearishness about most
things commodity-related, we expect that the A$ will soon breach
short-term support at 75 and begin making its way to the low-70s. However,
as always we remain open to other possibilities.
Updates on Stock Selections
Notes: 1) To review the complete list of current TSI stock selections, logon at
http://www.speculative-investor.com/new/market_logon.asp
and then click on "Stock Selections" in the menu. When at the Stock
Selections page, click on a stock's symbol to bring-up an archive of
our comments on the stock in question. 2) The Small Stock Watch List is
located at http://www.speculative-investor.com/new/smallstockwatch.html
Chart Sources
Charts appearing in today's commentary
are courtesy of:
http://stockcharts.com/index.html
![]()