|
- Interim Update 19th May 2010
Copyright
Reminder
The commentaries that appear at TSI
may not be distributed, in full or in part, without our written permission.
In particular, please note that the posting of extracts from TSI commentaries
at other web sites or providing links to TSI commentaries at other web
sites (for example, at discussion boards) without our written permission
is prohibited.
We reserve the right to immediately
terminate the subscription of any TSI subscriber who distributes the TSI
commentaries without our written permission.
Pay no attention to what they say
As
part of the 'rescue package' for financially distressed euro-zone
governments, the ECB has said that it will purchase the junk-rated
bonds issued by these governments. The bond purchases will be made
using euros that the ECB creates 'out of thin air', and will therefore,
by definition, be inflationary. However, the ECB has said that it will
"sterilise" its purchases of junk debt, thus mitigating or eliminating
any inflationary effects.
The ECB could implement this "sterilisation" by selling some of the
assets (bonds) that presently reside on its balance sheet (when a
central bank sells assets it takes money out of the economy). This
would be the normal way for a central bank to offset its injections of
new money. It seems, though, that the ECB is trying a different
approach. According to the Reuters article posted HERE,
the ECB is attempting to mitigate the inflationary effects of its bond
purchases -- that is, it is attempting to remove money from the economy
-- by paying commercial banks an interest rate of up to 1% to deposit
money at the central bank. This, however, means that any inflationary
effects are only being mitigated on a temporary basis, because the
deposited funds could be withdrawn at any time at the discretion of the
private banks (the deposits have a fixed time of only one week) and
because the deposited funds could be used as collateral for new loans.
It therefore appears to be "sterilisation" in name only.
In any case, the main point we want to make is that the ECB's promise
to "sterilise" its purchases is meaningless, because central banks
always make promises such as this regardless of their true intentions.
Remember that the central bank has two main functions: to keep the
inflation going AND to manage inflation expectations. The second of
these functions is carried out by manipulating statistics and giving
'lip service' to fighting inflation.
Energy
Uranium
We do not have in-depth knowledge of uranium supply and demand. In
general, those who do possess such knowledge have been anticipating a
new upward trend in the uranium price since the second half of 2008.
The following chart, however, shows that the spot uranium (U3O8) price
is languishing near its low of the past four years. This tells us that
despite all the plausible-sounding arguments for why the uranium price
will need to rise in order to bring enough new supply onto the market
to offset rising demand, at this stage there is ample supply to satisfy
demand with the price in the low-$40s.
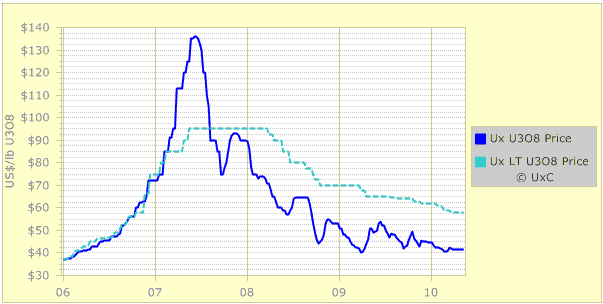
Chart Source: www.uxc.com
This is still our assessment. Uranium appears to have less downside
risk than almost any other commodity, largely because it 'sat out' the
post-crash rebound. But while having minimal downside risk is
important, for something to be an interesting speculation it must have
significant upside potential within a reasonable -- say, 12-month --
timeframe.
In our opinion, if the uranium price were going to experience a
meaningful rally in 2010 then the rally would have begun by now.
Therefore, we currently don't perceive sufficient intermediate-term
upside potential in the uranium price to warrant having any
uranium-related trading positions. We are, however, maintaining some
long-term exposure to uranium-mining stocks in line with our view that
nuclear energy is the only viable alternative to fossil-fuel energy for
large-scale electrical power generation.
Oil and Gas
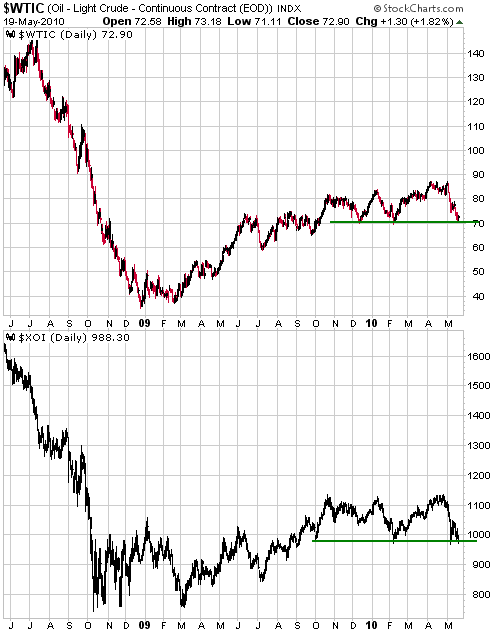
The top section of the following chart shows the price of crude oil and the bottom section shows the AMEX Oil Index (XOI).
Prior to Wednesday's bounce, the nearest oil futures contract had
fallen on 10 out of 11 trading days. In other words, it was 'oversold'.
It had also reached support defined by the February and December lows.
The AMEX Oil Index was in a similar position, except that in its case
the relevant support was defined by the lows of early-May, February and
October.
The oil market and the oil sector of the stock market will probably
rebound over the coming weeks, but it looks like intermediate-term
peaks were put in place during April. In other words, it is reasonable
to expect that rallies from here will end below the April highs and be
followed by declines to new lows for the year.
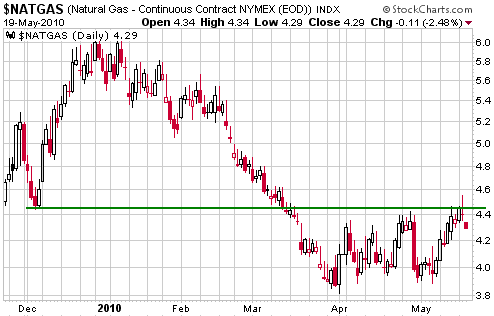
Note that it would be reasonable to maintain some long-term exposure to natural gas producers and drillers.
The Stock Market
In our 9th May update we wrote: "If
the US stock market is now at or close to a short-term bottom, the path
from here will likely involve a quick rally followed by a pullback to
test the low and then a longer/stronger rally. In wave terms: an A-B-C
upward correction. This upward correction could play out over 1-2
months, after which the intermediate-term decline would likely resume."
At this stage the market appears to be following the expected path,
with a quick initial rally ending on 12th May and then a pullback to
test the low.
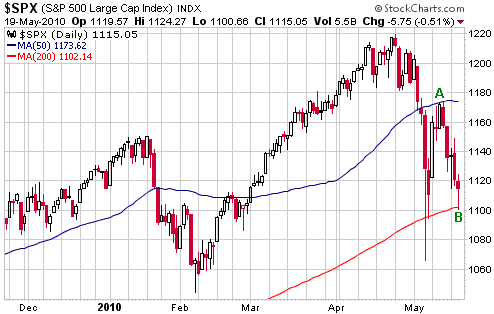
There is, of course,
a possibility that the S&P500 Index will drop below its early-May
low over the coming days, but any breach of the low in the near future
would very likely be short-lived. In our opinion, to set the stage for
a sustained breach of the early-May low the market will have to
rebound, or stabilise, for at least a few weeks.
Gold and
the Dollar
Gold
Gold Sentiment
Is gold sentiment at a dangerous extreme right now?
We don't believe so, because how could gold-related bullish sentiment
be dangerously high when so few members of the general public own gold?
Also, most sentiment indicators don't reveal unusually high bullish
sentiment for gold at this time. For example, here are some numbers
from Market Vane:
On 3rd March 2008 the bullish sentiment for gold was 95% with gold at $984
On 25th November 2009 the bullish sentiment for gold was 89% with gold at $1190
On 18th May 2010 the bullish sentiment for gold was 73% with gold at $1220
In other words, Market Vane's survey shows that bullish sentiment has
been making lower highs even while the price has been making higher
highs, and that a $240 increase in the gold price between 3rd March
2008 and 18th May 2010 was accompanied by a 22% slide in bullish
sentiment.
In our opinion, sentiment should not be used as the primary
decision-making factor in speculating, the reason being that sentiment
usually just follows price. Sentiment tends to be most useful during
periods when it diverges markedly from price, such as when the public
gets more bearish despite constructive price action or gets more
bullish despite deteriorating price action. In the gold market over the
past 27 months there has been a positive sentiment divergence in that
new highs have been accompanied by reduced enthusiasm.
Current Market Situation
The above sentiment discussion applies to gold in US$ terms. In euro
terms, sentiment towards gold very likely reached a short-term extreme,
and possibly reached an intermediate-term extreme, over the past few
days, due mainly to extreme negativity regarding the euro. This was
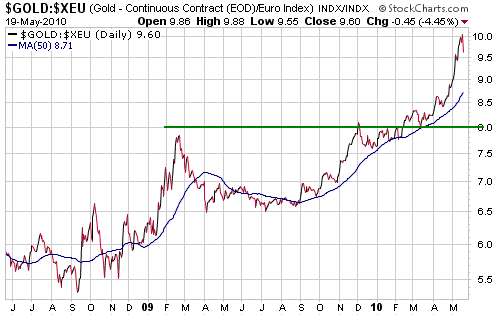
reflected by the euro-denominated gold price (gold/euro) moving 16%
above its 50-day moving average, making it as 'overbought' as it was at
the intermediate-term peaks of May-2006 and February-2009. A daily
chart of gold/euro is displayed below.
Wednesday's upward reversal in the euro and decline in the US$ gold
price is possibly an early warning signal that gold/euro made a peak of
at least short-term significance on Tuesday 18th May. If Tuesday's peak
was the short-term variety then support for gold/euro will likely be
found over the next month at, or above, 900, but if it was the
intermediate-term variety then support will probably be found at around
800 in 2-3 months time.
Despite how 'overbought' gold/euro recently became, our best guess is
that this week's peak will turn out to be the short-term variety. Our
reasoning is that the euro zone's government debt crisis could abate
for a while, but will return to centre-stage within the coming three
months.
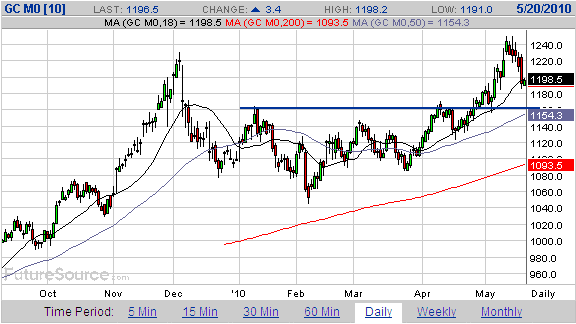
In US$ terms gold has
done no more than pull back to its 18-day moving average. Also, there
is strong support in the $1160s (about $30 below Wednesday's closing
price). Refer to the following daily chart of June gold futures for
details.
The downside potential from here does not appear to be worrisome, but support in the $1160s must hold.
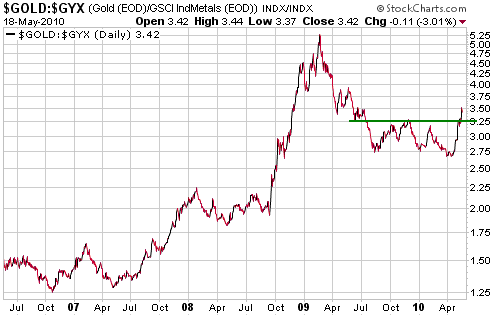
Relative to other
commodities, gold has done exactly what it should have done --
considering the financial/economic backdrop at the time -- every step
of the way over the past decade. And it continues to do so. For
example, relative to the industrial metals, which are probably the most
pro-cyclical commodities of all, gold has just broken out to the
upside. Refer to the following chart of the gold/GYX ratio for an
illustration of what we are talking about.
With growth expectations and the stock market rising from March of 2009
through to early-April of 2010 gold should have fallen in popularity
relative to the pro-cyclical industrial metals, which, of course, it
did. With evidence beginning to emerge that the recovery is over gold
should now be gaining in popularity relative to the industrial metals,
which appears to be the case.
Gold Stocks
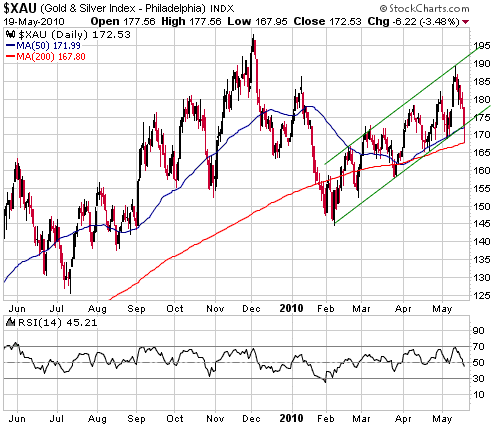
As reiterated in the latest Weekly Update, our favoured scenario
entails a gold-sector peak this month followed by a decline to an
October low.
This week's price action suggests that the anticipated May peak was put
in place last week. It also helps define some parameters, as follows:
1. The daily chart displayed below shows that the XAU has just dropped
from the top to the bottom of its channel. On an intra-day basis it
broke through the channel bottom on Wednesday and found support at its
200-day moving average, but then recouped enough of its losses to end
the day right at the channel bottom. This means that it has fallen as
far as it can without providing definitive evidence of an important
peak. That evidence would come in the form of a daily close below
Wednesday's intra-day low of 168.
2. A daily close above last week's XAU high of 190 -- which is not
expected to happen within the next few months, but cannot be ruled out
-- would now be a clear-cut signal that a new intermediate-term advance
was underway, especially if it occurred after the first week of June.
Currency Market Update
Germany's policymakers panic...AGAIN!
Germanyís BaFin financial-services regulator said on 18th May
that it would introduce a temporary ban on naked short selling and
naked credit-default swaps of euro-area government bonds. The ban would
also apply to naked short selling in shares of 10 banks and insurers
including Allianz SE and Deutsche Bank AG.
Europe's political leadership clearly believes that a large part of
'the problem' is that speculators are betting against some euro-zone
governments and financial institutions, and therefore believes that it
can improve the situation by curtailing the ability to make such bets.
This is an example of trying to cure the disease by suppressing the
symptoms.
It is reasonable to ask whether Europe's policy-makers will be able to
make enough wrong moves over the remainder of this year to drive the
euro all the way to parity with the US$. We don't think they will, but
only because of their counterparts in the US. It would be foolhardy, we
think, to under-estimate the ability of the US Federal Reserve to
underpin the euro by devaluing the US$.
Current Market Situation
The above-mentioned moronic policy move pushed the extremely 'oversold'
euro to a new 4-year low on Tuesday, but probably only delayed the
start of a rebound by 1-2 days.
With regard to the Outlook Summary that appears near the top of every
Weekly Market Update, we almost always avoid having opposing short- and
intermediate-term outlooks. For example, if we are intermediate-term
"bullish" then in general we will be short-term "bullish" or "neutral",
and if we are intermediate-term "bearish" then our short-term outlook
will generally be "bearish" or "neutral". This is done due to
overlapping timeframes and to minimise confusion, although there are
rare occasions when we think it makes sense for our intermediate-term
outlook to be the opposite of our short-term outlook. Now is one of
those occasions.
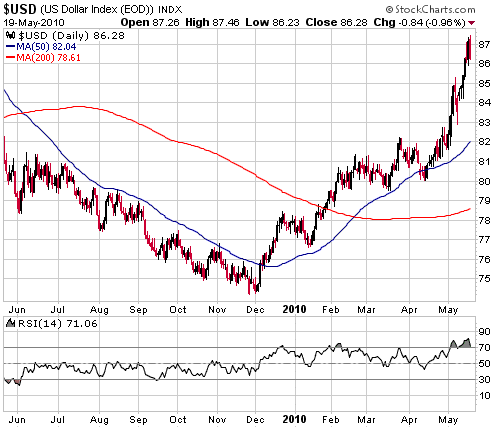
We expect that the Dollar Index will move up to the 90s before
year-end, but on a short-term basis the dollar's risk/reward appears to
be skewed towards risk due to the potential for a strong euro rebound
over the coming 1-2 months. We are therefore downgrading our short-term
US$ outlook to "bearish" while leaving our intermediate-term US$
outlook "bullish".
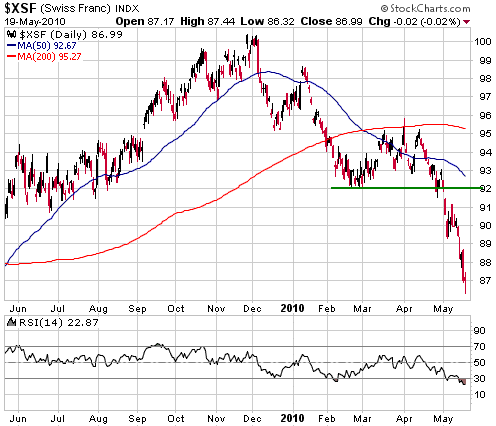
Presented, below, are daily charts of the Dollar Index and the Swiss
Franc. The dollar's short-term downside potential is probably limited
by support at 81-82, while the Swiss Franc has the potential to rebound
to former support (now resistance) at 92 over the next couple of
months.
Update
on Stock Selections
(Notes: 1) To review the complete list of current TSI stock selections, logon at http://www.speculative-investor.com/new/market_logon.asp
and then click on "Stock Selections" in the menu. When at the Stock
Selections page, click on a stock's symbol to bring-up an archive of
our comments on the stock in question. 2) The Small Stock Watch List is
located at http://www.speculative-investor.com/new/smallstockwatch.html)
 US Silver (TSXV: USA). Shares: 251M issued, 289M fully diluted. Recent price: C$0.22 US Silver (TSXV: USA). Shares: 251M issued, 289M fully diluted. Recent price: C$0.22
Because its financial performance is strongly leveraged to changes in
the spot silver price, USA.V will be a good stock to own when silver
finally makes a sustained move above its March-2008 peak. For the same
reason, it will not be a good stock to own if silver trends lower over
the months ahead.
We currently perceive enough risk of a multi-month decline in the
silver price to prompt us to make an exit from USA.V. Based on
Wednesday's closing price of C$0.22 and our October-2008 entry at
C$0.17, the profit on this trade was 29.4%.
Chart Sources
Charts appearing in today's commentary
are courtesy of:
http://stockcharts.com/index.html
http://www.futuresource.com/

|

