|
- Interim Update 19th July 2006
Copyright
Reminder
The commentaries that appear at TSI
may not be distributed, in full or in part, without our written permission.
In particular, please note that the posting of extracts from TSI commentaries
at other web sites or providing links to TSI commentaries at other web
sites (for example, at discussion boards) without our written permission
is prohibited.
We reserve the right to immediately
terminate the subscription of any TSI subscriber who distributes the TSI
commentaries without our written permission.
Carry Trades
Behind every carry trade is a central bank
"Carry trade" is the generic name for any trade that involves borrowing
at one interest rate in order to invest in something that provides a
higher interest rate or, more generally, a higher rate of return. Over
the past several years these types of trades have regularly provided
hedge funds and investment banks with large profits and occasionally --
in the rare cases when the trades have gone awry -- caused them to
incur large losses. For example, during 2001-2004, when US short-term
interest rates were way below long-term interest rates, banks and hedge
funds generated substantial profits by borrowing short-term money in
order to finance the purchase of long-term bonds (note that by
employing 10:1 leverage, a 4% spread between long-term and short-term
interest rates can be parlayed into a 40% return on investment). And
when this particular carry trade became non-viable due to the
flattening of the US yield curve, that is, when the gap between
short-term and long-term interest rates in the US became too narrow to
make the aforementioned carry trade worthwhile, carry trades continued
to flourish because investment banks and hedge funds were still able to
borrow short-term money in Japan at extremely low interest rates.
Although hedge funds and investment banks are the major participants in
the various popular carry trades, they don't create the trades. The
fact is that every carry trade is the progeny of a central bank.
Putting it another way, a carry trade could never exist without the
support/intervention of a central bank. This is because the act of
borrowing short-term money in order to buy something that has a higher
return will, if done on a large scale, quickly elevate the cost of the
short-term money to the point where the trade becomes unprofitable. It
is only when a central bank intervenes to hold down the cost of
short-term money -- something the Fed did during 2001-2004 and
something the Bank of Japan has been doing for many years -- that the
opportunity to make money from a carry trade will persist beyond the
very short-term.
Think of it this way: if a situation arises where the cost of
short-term money is low enough to entice large speculators into a carry
trade then the speculative demand for short-term money will increase
and, in the absence of an offsetting increase in money supply, the cost
of the short-term money will rise. As a result, the trade will quickly
lose its appeal. However, if a central bank happens to be standing
there supplying whatever additional money is needed to keep the
short-term interest rate from rising then an arbitrage opportunity that
would otherwise have quickly disappeared becomes entrenched.
The bottom line is that in every case where a carry trade has become
popular it is because a central bank has counteracted normal market
forces.
The Yen carry trade
The Yen carry trade has been popular for several years thanks to the
Bank of Japan doggedly keeping short-term interest rates near zero, but
over the past 18 months its popularity has grown to the point where it
has become one of the most important influences on global currency,
bond, stock and commodity markets. It has, for instance, caused the Yen
to become a very weak currency (a Yen carry trade begins with the
borrowing and selling of Yen) and boosted the prices of metals and
equities (metals and equities have been purchased with the funds
obtained via Yen carry trades).
The total quantity of Yen borrowed/sold as the result of carry trades
is unknown, but it must be a gargantuan number and it represents a
speculative short position in the Japanese currency. Speculative short
positions must eventually be covered, so at some point there will be a
veritable tsunami of Yen buying as the carry trades that have been
established over the past few years get unwound.
Despite the Bank of Japan (BOJ) having just taken the first step in a
long journey towards a more normal interest rate environment (the
official short-term interest rate in Japan was boosted from 0% to 0.25%
late last week) there are no signs yet, however, that the large-scale
unwinding of carry trades has begun. In fact, the Yen's recent weakness
suggests that the Yen carry trade is still expanding.
Hedge funds appear to be taking the view that short-term money in Japan
is still almost free and that getting Japanese interest rates to a
'normal' level will be a very drawn-out process. Furthermore, the hedge
funds engaged in Yen carry trades will have been encouraged by the
recent 'dovish' comments emanating from Japan's political
establishment. It is clear that Japan's central bankers want to return
the country to 'interest rate normalcy', but the politicians are
fearful of doing anything that might lead to some short-term weakness
in the economy.
The following weekly chart of Yen futures shows the currency's
precarious technical position. This chart certainly won't cause
carry-traders to lose any sleep because it suggests that the Yen is
close to breaking towards new lows for the year.
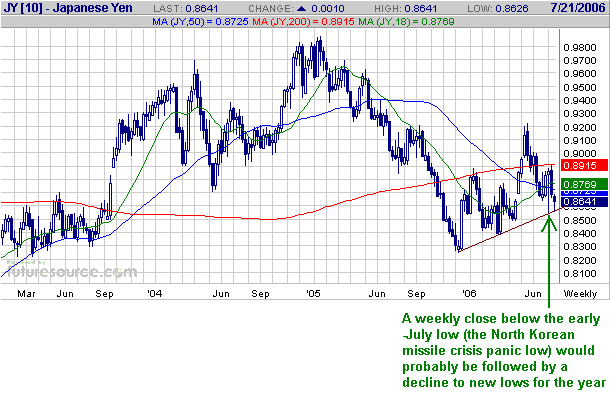
Our view on the Yen
is unchanged. We are long-term bulls on the currency, but don't expect
it to make much upward progress this year. We also don't expect it to
drop far below last December's low and would be accumulating
longer-term positions in the low-80s.
The Stock Market
Current Market Situation
The instructions shouted by hedge fund managers to their head traders on Wednesday morning: "I
don't care if it's S&P500 futures or gold or bonds or British
Pounds or asset-backed securities collateralised by breast implants; if
it moves, buy it; if it doesn't move, buy it anyway because, praise the
Lord, Bernanke has just hinted that the Fed might stop hiking interest
rates at some point".
We don't know who is sillier -- the central banker who makes silly
comments or the trader who reacts to the comments as if they were
meaningful.
There were spirited rallies in many markets, including the US stock
market, on Wednesday after Fed Chief Bernanke reported to Congress that
economic growth was moderating and, therefore, that inflation pressures
were likely to ease over the coming months. Let's put aside, for a
moment, the fact that real economic growth and inflation pressures are
INVERSELY correlated (higher real growth results in the production of
more stuff, which, in turn, puts downward pressure on prices unless
there's an offsetting increase in the money supply) and recall that a)
Wednesday's scenario has been replicated numerous times over the past
few months, including just prior to the May peak in equity and metal
prices, and b) there's a historical tendency for the US stock market to
perform poorly during the 6 months and the 12 months following the END
of a Fed rate-hiking campaign.
Although it was spirited, Wednesday's rally in the US stock market was
not especially bullish. In particular, a 2% gain in the Dow was only
accompanied by a 1.2% gain in the NDX. On a truly bullish day, a 2%
gain in the Dow would be accompanied by a 3-4% gain in the NDX.
Nevertheless, it's possible that more bullish behaviour will emerge
over the coming days and that the Dow (see chart below) has just
completed a successful test of important support.
Our view is that this
is a dangerous time to make large short-term bets on either a bullish
or a bearish outcome. Positive divergences are few and far between so
it wouldn't be surprising if the recent rebound were to soon fail and
be followed by a break to new lows for the year, but at the same time
the market has become sufficiently oversold to support a rally that
takes the S&P500 and the Dow back to their May highs. We therefore
think it's prudent to wait for either a better buying opportunity or a
better selling opportunity to emerge before speculating on any
short-term outcome for the broad market.
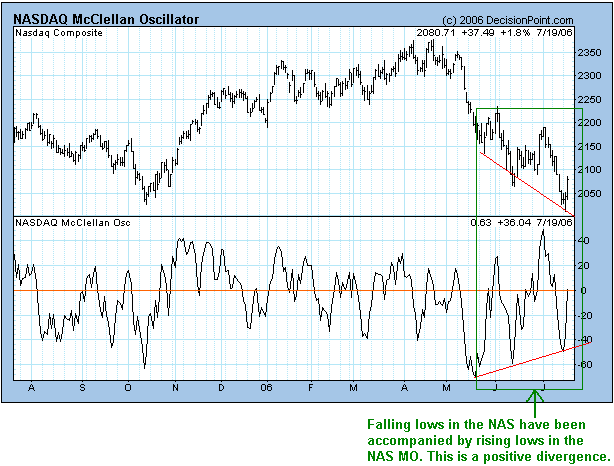
By the way, there has been one notable positive divergence over the
past 2 months: the positive divergence between the NASDAQ Composite
Index and the NASDAQ's McClellan Oscillator (MO) shown on the following
chart.
The bear market of 2005-2006
If a worldwide cyclical* bear market in equities began earlier this
year then it has, to date, been a very selective one. Most of the
Middle-Eastern equity indices are clearly immersed in cyclical bear
markets, as are the technology-oriented sectors in the US. However, at
this stage the declines experienced by most stock market indices don't
look any more serious than the sorts of pullbacks that regularly occur
within cyclical bull markets.
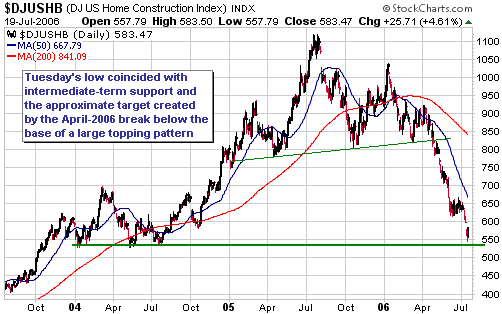
One US market sector that has most definitely been immersed in a
cyclical bear market for quite some time is the homebuilding sector.
Note, though, that this week's low in the Dow Jones US Home
Construction Index (DJUSHB) hit a level that we mentioned, a few months
ago, as a likely target for the ultimate bear market bottom (see chart
below). If a bottoming process has begun it will likely entail a
multi-week rally followed by a pullback to test the low; that is, a 'W
bottom' as opposed to a 'V bottom'.
We aren't interested in making any bullish bets on the homebuilders at
this time, but might become interested late this year or early next.
While we're on the
topic of the homebuilders, note, with reference to the following weekly
chart, that the >60% decline in the stock price of homebuilder Toll
Brothers (NYSE: TOL) over the past 11 months has simply taken the stock
to the bottom of its long-term upward-sloping channel.
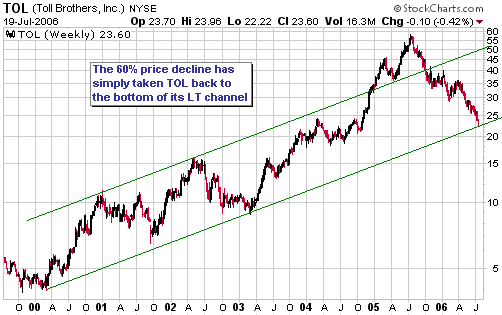
The downturn in the
homebuilding stocks has been brutal, but sector-wide declines of this
magnitude are not uncommon during secular bull markets when gains of
several hundred percent have been achieved over the preceding few
years. As examples, the 1964-1980 secular bull market in gold stocks
was punctuated by two declines of more than 50%, the Semiconductor
Index (SOX) experienced two 50% corrections during the bull market of
the 1990s, and the gold sector has already experienced two 40% declines
during its current bull market.
*Cyclical trends
occur within secular trends. For example, the secular bear market in US
equities that began in 2000 is likely to encompass a number of cyclical
bull and bear markets.
Gold and
the Dollar
Currency Market Update
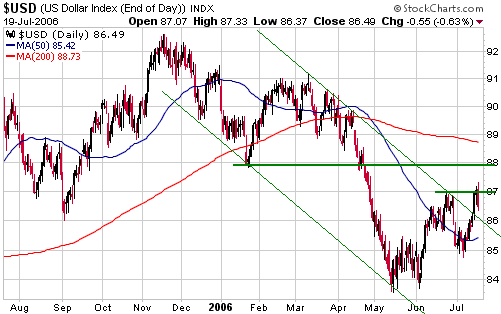
Refer to the following daily chart of the Dollar Index.
The Dollar Index blasted out of its downward-sloping channel on Monday
and consolidated its gains on Tuesday. It then pulled back sharply on
Wednesday in response to the revelation that the Fed's rate-hiking
campaign will eventually come to an end.
If Monday's upside breakout was real (we suspect that it was) then the
Dollar Index should hold above its 50-day moving average during future
pullbacks.
Gold
Gold quickly lost its war premium during the first two days of this
week even though the conflict in the Middle East has, if anything,
escalated. If more negative news emanates from the Middle East over the
coming days/weeks then a war premium might once again get built into
the gold price, but such gains will also prove to be transitory
because, as discussed in the latest Weekly Market Update, gold is not a
hedge against military conflict.
Gold Stocks
Current Market Situation
The gold sector rebounded strongly alongside a strong rebound in the
financial sector on Wednesday, an indication that the gains were driven
by expectations of rising liquidity. However and as discussed in many
previous commentaries, gold-related investments do best relative to
other investments when liquidity is contracting.
Wednesday's rally in the gold sector is most likely not the start of a
big move to the upside. Note, though, that in the latest Weekly Update
we said that the near-term downside risk appeared to be limited to
around 10%. At Tuesday's low the HUI was down by 6.5% from Friday's
closing level so at that point the market had dropped almost as far as
we had said it might. Ideally the HUI would have pulled back to the
low-300s -- an area that coincides with some lateral support and the
200-day moving average (see chart below) -- before beginning to rally,
but the Bernanke-fueled surge in the prices of almost everything that
could possibly benefit from easier money might have cut-short the
pullback.

We continue to expect
that there will be at least one full-blown test of the June low before
the gold sector's correction comes to an end and that the correction is
unlikely to end before November-2006. In the mean time, September is a
likely month for an intervening rebound peak.
Not all gold stocks are in synch
Gold stock indices such as the HUI and the XAU peaked during the first
half of May and probably made their price lows for the correction in
June (although, as noted above, the correction is likely to continue
until at least November). However, not all gold stocks are in synch
with the indices. We've previously warned, for instance, that while the
indices would likely hold above their June lows there was a good chance
that many exploration-stage gold stocks would make progressively lower
lows over the remainder of this year due to retail investors losing
patience and 'throwing in the towel'. Unfortunately or fortunately,
depending on whether you are a current owner or a prospective future
owner of these types of stocks, the exploration-stage juniors are
following the expected pattern.
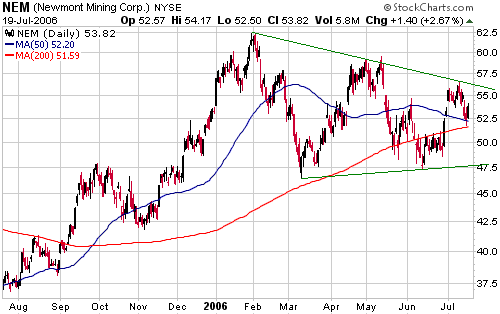
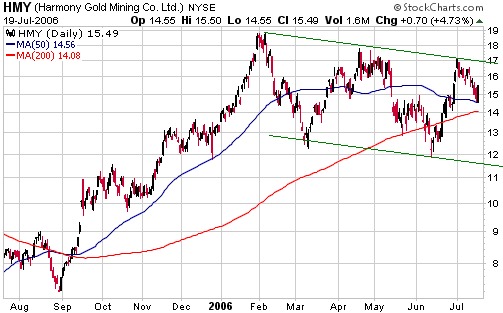
It's also the case that some of the major gold stocks are out of synch
with the indices. For example, the following charts show that Newmont
Mining (NYSE: NEM) and Harmony Gold (NYSE: HMY) commenced
intermediate-term corrections at the end of January (more than 3 months
in advance of the indices) and are therefore already about 6 months
into the corrective process.
NEM has superior management to HMY, but we are much more interested in
HMY and highlighted it as a buy on a few occasions when it was trading
near its lows in May and June. The reason we prefer HMY to NEM, despite
the latter's superior management, is because it offers a lot more
leverage to gold and because we expect the Rand gold price to rise
relative to the US$ gold price over the next 12 months (it's the gold
price in Rand terms that determines HMY's profit margin).
For those looking to take new positions or add to existing positions in
the gold majors, the ideal area to buy HMY would be in the 13s (we
doubt that it will trade below $13) and the ideal area to buy NEM would
be in the high 40s. Alternatively, those willing to swap some upside
potential for greater comfort could hold-off buying until the stocks
break upward from their respective consolidation patterns. Daily closes
above the June high for HMY and the July high for NEM would constitute
upside breakouts.
Update
on Stock Selections
(Note: To review the complete list of current TSI stock selections, logon at http://www.speculative-investor.com/new/market_logon.asp
and then click on "Stock Selections" in the menu. When at the Stock
Selections page, click on a stock's symbol to bring-up an archive of our comments on the stock in question)
 Lion Selection Group (ASX: LSG). Shares: 100M. Recent price: AUD1.93 Lion Selection Group (ASX: LSG). Shares: 100M. Recent price: AUD1.93
We wanted to once again highlight LSG, an Australia-based investment
company that invests in junior resource stocks. Late last week LSG
announced that it had accepted a bid from AuSelect (ASX: AUS), another
Australia-based investment company that invests in junior resource
stocks, for one of its investments (Sedimentary Holdings). LSG has said
that if the deal is finalised then the AuSelect shares it receives will
be distributed to LSG shareholders. At the current AUS stock price this
would be equivalent to a 20c dividend.
Earlier this year LSG realised a profit of AUD38M (38c per share) from
the sale of another investment and it's very likely that a significant
portion of this profit will also be distributed to LSG shareholders
later this year.
LSG isn't likely to experience the spectacular price moves (in both
directions) that are common amongst junior mining stocks because it is,
in effect, a portfolio of junior mining stocks. Rather, it should be a
steady performer over the coming years. Management's policy of paying
out a large portion of each realised investment gain to shareholders
reduces the leverage and therefore the potential upside in the stock
price, but it also reduces the risk and means that LSG is a lot closer
to being an investment-grade opportunity than most of the companies
that are developing their own mines.
American Capital Gold (TSXV: AAU)
The MD&A (Management Discussion and Analysis) published by
Chesapeake Gold (TSXV: CKG) on 31st May contained the following update
on the planned merger of CKG and American Capital Gold (TSXV: AAU):
"On March 3, 2006
Chesapeake agreed to merge with American Gold Capital Corporation
("American Gold"), a public company listed on the TSX Venture Exchange.
American Gold owns two major gold-silver deposits, Metates and
Talapoosa, located in Mexico and Nevada. If the proposed merger is
completed, Chesapeake will have approximately $40 million in cash and
long term investments, the largest undeveloped gold and silver deposit
in Mexico, an advanced Nevada gold project with a mineral resource of
over 1.2 million ounces together with a dominant pipeline of
exploration and development projects in Mexico.
The merger closing date
has been delayed until late July as a result of a due diligent review
of the potential tax consequences to certain American Gold shareholders
(post-merger)."
This is the latest information released by CKG/AAU regarding the status
of the agreed merger, so at this stage we are assuming that the merger
will be complete by the end of this month.
Our interest is in the CKG warrants and rights that will be issued to
AAU shareholders when the merger is completed, and we added AAU to the
Stocks List in April to ensure that we would have a foothold in these
warrants and rights -- especially the rights -- at a reasonable price.
The risk, at the time, was that the gold price would surprise us by
rocketing up to $850 before the intermediate-term correction we were
anticipating commenced. If this had happened the rights would have
become very valuable (AAU would have become very expensive) because
they confer the right to purchase CKG shares at C$1.00 if, and only if,
the spot gold price trades at an average of at least US$850 for 90
days. Refer to our previous write-ups on AAU at http://www.speculative-investor.com/new/AAU.html for further details on the merger terms.
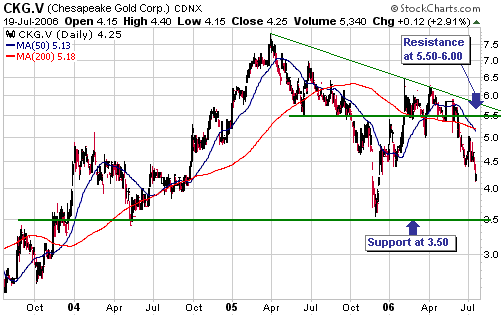
Below is a 3-year chart of CKG. The stock has been dragged down by the
general weakness in exploration-stage gold shares and by a lack of
news. It's such a thinly traded stock that it wouldn't take much
additional selling to knock the price down to long-term support at
C$3.50, but neither would it take much of an increase in buying to lift
the price up to resistance at C$5.50-$6.00.
AAU is really just a derivative play on CKG and at Wednesday's closing
price of C$4.25 we estimate the value of the CKG shares, warrants and
rights that will be received by AAU shareholders as a result of the
merger to be approximately C$1.90. AAU therefore offers good value at
Wednesday's closing price of C$1.63.
If you expect that
gold will trade handily above $850 within the next 5 years then you
should consider buying some AAU shares now. Alternatively, you could
reasonably decide not to buy any AAU shares and, instead, plan to
purchase the CKG rights and/or warrants when they begin trading on the
stock exchange. In our opinion, the strategy that makes the most sense
is to own some AAU shares now in order to have the aforementioned
foothold in the rights/warrants and to plan on buying more rights
and/or warrants later.
New opportunity: Chesapeake Energy (NYSE: CHK) or Chesapeake Energy call options
Further to the developing opportunity in natural gas (NG) that we've
discussed in TSI commentaries over the past two months we've decided to
add another NG-related position to the TSI List.
Chesapeake Energy (NYSE: CHK), which, by the way, is not related in any
way to Chesapeake Gold, is a major US-based NG producer with
substantial leverage to the NG price. On a price/sales basis the stock
is quite expensive (it trades at more than 3-times annual sales), but
on a price/earnings basis it is very inexpensive (it trades at less
than 8-times earnings). In any case, we are adding CHK as a trade with
an expected holding period of 2-6 months rather than as a longer-term
investment, so valuation isn't a major issue.
With reference to the following chart, we like the fact that CHK has
oscillated back and forth within a gradually narrowing range over the
past 10 months. This pattern has the look of a consolidation within a
longer-term upward trend as opposed to a major top.
We are going to add the Chesapeake Energy January-2007 $30.00 call
options (CHKAF) to the TSI Stocks List at Wednesday's closing price of
US$3.10, but those who are not familiar/comfortable with options should
purchase the stock rather than the options. We've noted our suggested
entry plan and initial stop-loss level on the chart.
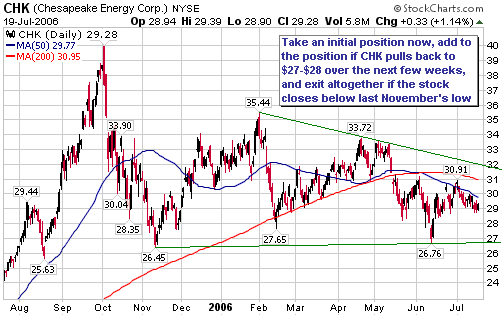
Chart Sources
Charts appearing in today's commentary
are courtesy of:
http://stockcharts.com/index.html
http://www.futuresource.com/
http://www.decisionpoint.com/
|
