![]()
![]()
![]()
![]()
- Interim Update 19th July 2017
Copyright
Reminder
The commentaries that appear at TSI
may not be distributed, in full or in part, without our written permission.
In particular, please note that the posting of extracts from TSI commentaries
at other web sites or providing links to TSI commentaries at other web
sites (for example, at discussion boards) without our written permission
is prohibited.
We reserve the right to immediately
terminate the subscription of any TSI subscriber who distributes the TSI
commentaries without our written permission.
Is a new uranium bull
market finally about to begin?
We have no idea if a uranium
bull market is finally about to begin, but as noted in the email sent to
subscribers following Tuesday's trading session there are early signs that
the uranium-mining sector has commenced another tradable rally.
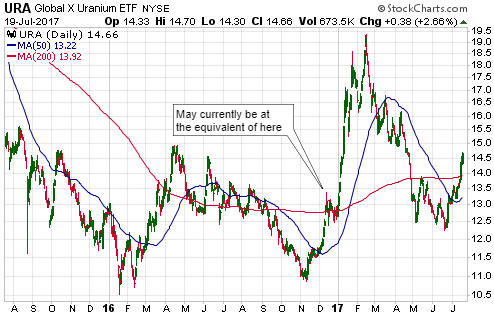
The
uranium sector's recent upward reversal is clearly evident on the
following daily chart of the Global X Uranium ETF (URA). Notice that URA
reversed upward shortly after breaching its May low in mid-June and has
since moved well above its 200-day MA. It looks a little stretched to the
upside on a short-term basis and could consolidate over the next couple of
weeks in similar fashion to how it consolidated for about 2 weeks during
December, so new buying should probably wait for a pullback to the
vicinity of the 200-day MA.
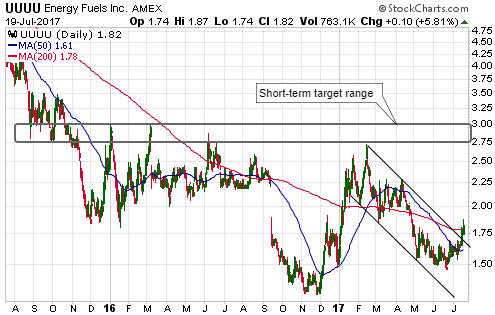
Via the above-mentioned email we added a TSI trading position in
Energy Fuels (UUUU), a US-based producer of uranium with a solid balance
sheet and a reasonable valuation. In addition to not being as short-term
'overbought' as URA, UUUU has greater reward potential. That being said,
there is company-specific risk with UUUU that can be avoided or at least
greatly reduced by purchasing an ETF that holds numerous stocks.
The recent strength in the uranium sector of the stock market has not
yet been confirmed by strength in the market for the underlying commodity.
As illustrated below, the spot uranium price is languishing not far from
the 10-year low reached last November.
For there to be anything
more than a short-term rebound in the uranium-mining sector the spot
uranium price will have to move above $25/pound.
The Stock Market
Interest rates and
equity valuations
When determining the extent to which the
stock market is over or under valued, should we take into account the
current level of interest rates?
The answer is no; while the
current level of interest rates can affect the perceptions of market
participants and can therefore affect prices, it has no bearing on what
constitutes fair value. Regardless of the prevailing interest rate, a
market-wide average P/E ratio of <10 can reasonably be considered cheap
and a market-wide average P/E ratio of >18 can reasonably be considered
expensive.
The idea that the current yield on a long-term
government bond should be used to determine 'fair value' for the stock
market was popularised during the 1980s and 1990s, but there is no logical
basis for it. This is because a stock is a claim on the cash that a
company will generate over the remainder of its life. It makes no sense to
consider the sum of these cash flows in relation to the interest rate at
any single point in time, regardless of whether that point in time is
today or a day many years into the future.
Also, there is no
historical basis for it because a long-term comparison of the average P/E
ratio and interest rates reveals that secular bear markets end with the
P/E ratio below 10, regardless of whether interest rates are high or low.
For example, the secular bear market of 1929-1942 ended with the S&P500's
P/E ratio below 10 and interest rates at very low levels, and the secular
bear market of 1966-1982 ended with the S&P500's P/E ratio below 10 and
interest rates at very high levels.
The bottom line is that there
is a high probability of the S&P500's P/E ratio eventually dropping into
single digits, irrespective of whether the yield on the 10-year T-Note
remains at an unusually low level or moves substantially higher.
The NASDAQ100 (NDX) makes a new high
Most US stock
indices made new highs on Wednesday 19th July. Most importantly, the NDX
made a new high and therefore confirmed last week's upside breakout by the
S&P500 (SPX).
The new highs shouldn't be viewed as signals that
all is clear. The risk for those maintaining bearish bets is that the
recent upside breakouts have marked the beginning of a new speculative
fling that will last at least one month and could last as long as three
months. However, the risk for those holding or adding to bullish bets is
that the upside breakouts will prove to be misleading.
When a
market breaks above resistance to a new high there is always a risk that
the breakout will fail, but right now in the US stock market the risk of a
breakout failure is higher than normal. This is partly due to the timing
of the breakout. In particular, we note that a) the month of July has a
history of containing false/misleading upside breakouts, and b) the NDX's
recent price action is eerily similar to its price action at this time two
years ago.
With regard to point b), the first of the following
daily charts shows that in July of 2015 the NDX broke out to the upside
and shortly thereafter reached an important top. Furthermore, the top was
on 20th July at the end of an 8-day winning streak. The second chart shows
that the NDX broke out to the upside on 19th July of this year at the end
of a 9-day winning streak.
If the NDX reverses downward over the
final two days of this week it will remain in synch with the topping
action of 2015.

Despite the on-going potential for a big move to the downside within
the coming several weeks, we have respected the protective stop set on the
QID (ProShares UltraShort QQQ) trading position that was added to the TSI
Stocks List last month. One of the reasons for adding QID at the time was
that the loss could be restricted to 5% or less if the NDX failed to
follow through to the downside and instead made a new high. The loss on
the trade turned out to be slightly less than 5%.
If evidence
emerges that this week's upside breakout was a 'fakeout' then we'll
consider returning QID to the List, but it wouldn't be prudent to assume a
false breakout in the absence of any evidence. The reason, as mentioned
above, is that the recent upside breakouts COULD have marked the beginning
of a new speculative fling that will last as long as three months.
Commodity-related equities
We like the idea of
positioning for intermediate-term upside in the stocks of companies
focused on industrial commodities and simultaneously positioning for
short-term downside in the NASDAQ100 Index (NDX) and/or some of its
highest-profile components. As well as being supported by relative
valuation, this positioning is supported by a general shift in speculative
focus that began in May and is still, we think, in its infancy.
Along these lines, in last week's Interim Update we wrote:
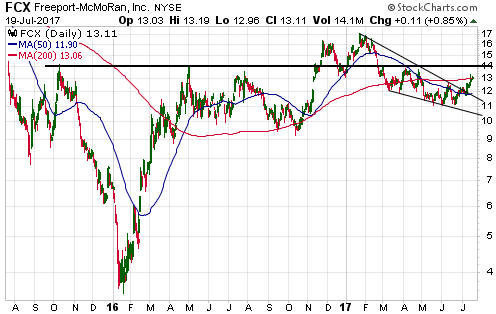
"...Freeport
McMoran (FCX), the world's largest publicly-traded copper producer, could
be a reasonable short-term or intermediate-term speculation at this time.
This is due to its chart pattern and the strong potential for the copper
price to make a new multi-year high within the next few months."
FCX has since risen from US$12.27 to US$13.11 (about 7%), but if we
are right then the rally is just beginning. If we are wrong it will likely
be because FCX and other commodity-related equities get taken down as part
of a general stock-market decline led by the NDX's largest components.
Gold and the Dollar
Gold
The
rebound in the US$ gold price continued over the first three days of this
week. It is probably a counter-trend rebound that will end within the next
week or so, but with the fundamental backdrop possibly in the process of
turning gold-bullish it could be something more substantial.
Silver
Although we think the odds favour a
final decline in the silver price to new lows prior to the start of a
rally that from our perspective is worth trading, that is, a rally that
lasts at least a few months, the silver market has fulfilled all bar one
of our requirements for an intermediate-term bottom. We must therefore
acknowledge the possibility that an intermediate-term bottom was put in
place by the early-July 'flash crash' to the $14.30s.
One of the
requirements for a sustainable price bottom was a lower-low in the price
combined with a higher-low in momentum as indicated by the daily RSI(14).
This was mentioned at least twice in TSI commentaries when the silver
price became extremely 'oversold' during the first half of May. For
example, in the 8th May Weekly Update we wrote:
"The silver
market is very interesting right now due to the extent that it is
'oversold'. The silver price has fallen on 13 of the past 14 trading days
and its daily RSI...ended last week at only 19.5.
The 'oversold'
extreme makes it likely that a rebound will soon begin, but it does not
imply that a sustainable low is close at hand. The momentum low has
probably just been put in place or will be put in place over the next two
trading days, but extreme lows for daily momentum usually occur well
before sustainable price lows are reached.
We suspect that there
will be an opportunity to buy silver below $15 within the coming three
months..."
Three trading days later, we wrote:
"The
silver extreme became even more so over the first two days of this week.
In particular, by the close of trading on Tuesday 9th May silver's daily
RSI(14) was near a 20-year low of only 17.4 and the price had fallen on 15
of the latest 16 trading days."
And:
"Based on what
happened in the past following similar short-term momentum extremes (as
indicated by the daily RSI), this week's low will NOT be the final low but
it will hold for a few weeks. Here's the sequence that we can reasonably
expect:
1) A rebound from this week's low that lasts about 2 weeks
and reaches the 20-day MA (the black line on the above chart) or a little
higher. The rebound target range noted in the latest Weekly Update
($17.00-$17.50) is still applicable.
2) A decline that takes the
price either slightly below the May low or well below the May low. Whether
it's slightly below or well below will mostly be determined by the extent
to which the speculative net-long position has been reduced and what's
happening in the gold market at the time the May low is breached.
3) A tradable multi-month rally."
The silver price then
followed the expected sequence almost 'to a T'. Specifically, there was a
3-week rebound that ended near $17.50 and then a decline to below the May
low. Furthermore, at the price low for the year (to date) in early-July
the daily RSI was comfortably above its level at the 9th May price low,
leaving 9th May as the momentum low.
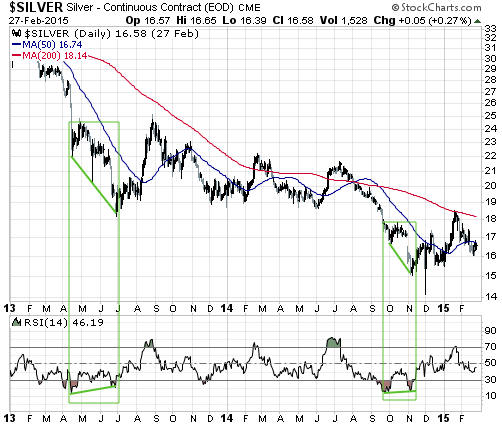
Here's a daily chart showing
examples from 2013-2014 of silver making a momentum low 1-3 months prior
to the price low:
And here's a daily chart showing the current situation:
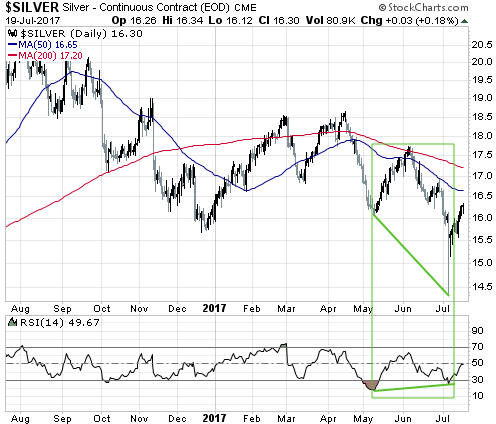
The one requirement for an intermediate-term price bottom that silver
hasn't yet fulfilled is a decline in the Comex open interest to 160K
contracts. To date, open interest has only pulled back a little from the
all-time high made earlier this year, meaning that many leveraged
speculators in the futures market have stuck with their bullish silver
positions despite the dismal price action (the contraction in the
speculative NET-long position has been due more to the entry of new
speculative shorts than to the exit of old speculative longs). This leaves
the door open to a final capitulation of speculative longs.
A daily
close above the 50-day MA would suggest that a multi-month rally had begun
without the aforementioned final capitulation.
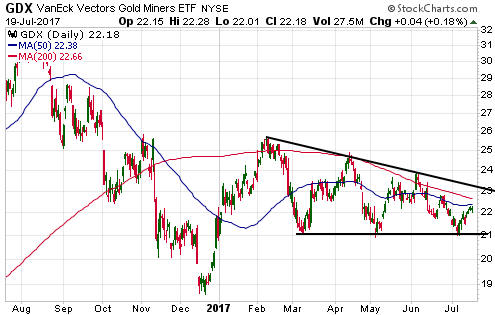
Gold Stocks
The gold-mining sector, as represented on the following daily chart by
GDX, has two potential paths to a buy signal, with the first path
involving a break above the downward-sloping trend-line that dates back to
the early-February peak.
We rarely get more enthusiastic about an
investment/speculation in response to an upside breakout, because doing so
means liking exactly the same investment more at a higher price than at a
lower price. In most cases this makes no sense. The exception is when the
upside breakout follows a consolidation lasting many months, which would
now be the case for GDX if it were to break above $23.20.
The
second potential path to a buy signal involves a break below the
March-May-July triple-bottom at $21.00 followed by either a steep 2-4 week
decline to an 'oversold' extreme or a quick reversal that paints the
breakdown as false.
The second of the potential paths would create
the buying opportunity with the superior risk/reward, but we'll see what
happens. One way or the other we are likely to get a sector-wide buying
opportunity by the first half of September.
The Currency Market
The euro is 'overbought'
in momentum terms and has almost reached intermediate-term resistance
defined by last year's high. Also, the COT data inform us that
speculators, as a group, are now more bullish on the euro than at any time
since 2011. The stage is therefore set for a reversal.
Updates on Stock Selections
Notes: 1) To review the complete list of current TSI stock selections, logon at
http://www.speculative-investor.com/new/market_logon.asp
and then click on "Stock Selections" in the menu. When at the Stock
Selections page, click on a stock's symbol to bring-up an archive of
our comments on the stock in question. 2) The Small Stock Watch List is
located at http://www.speculative-investor.com/new/smallstockwatch.html
Chart Sources
Charts appearing in today's commentary
are courtesy of:
http://stockcharts.com/index.html
http://www.uxc.com/
![]()