![]()
![]()
![]()
![]()
- Interim Update 19th September 2018
Copyright
Reminder
The commentaries that appear at TSI
may not be distributed, in full or in part, without our written permission.
In particular, please note that the posting of extracts from TSI commentaries
at other web sites or providing links to TSI commentaries at other web
sites (for example, at discussion boards) without our written permission
is prohibited.
We reserve the right to immediately
terminate the subscription of any TSI subscriber who distributes the TSI
commentaries without our written permission.
Housekeeping
Taking a break
Please note that TSI will be on vacation next week. A Weekly Update
will be published this weekend (22-23 September), but there will be no
Interim Update next week and no Weekly Update on 30 September. We'll be on
a remote island and may not have ready access to a reliable internet
connection, but we still should be able to send out a brief update via
email if something unexpected and dramatic happens in the markets while we
are away from the office.
Problems receiving TSI emails
If you have an aol.com, a verizon.com or a rogers.com email address
then there's a good chance that you didn't receive email notification of
the last two TSI reports (the Interim Update published on 13th September
and the Weekly Update published on 16th September). It seems that after a
great many years with no issues, the aforementioned ISPs have decided to
block our emails. When an email is blocked by an ISP it registers as a
"bounce" in the reports that our email provider (MailChimp) generates for
us.
We are making a minor change to the way the emails are sent
that hopefully will get around the problem. The change should be fully
implemented by the time we send out the email for the Weekly Update.
On a related matter, you always can get access to the commentaries by
logging in at the TSI web site.
Industrial Metals
Update
Copper Bottom
President Trump announced earlier this week that he was going ahead
with tariffs on US$200B of goods imported from China. The tariff (tax) on
these goods will be 10% beginning next Monday, increasing to 25% on 1st
January. Naturally, China's government responded in kind if not in size.
The tariffs constitute a war on consumers, with the US government
attacking US consumers and China's government retaliating by attacking
Chinese consumers. It brings to mind the movie "Fight Club", in which the
main character sometimes beats himself up.
It appears that Trump is
willing to escalate the war on US consumers until something breaks. The
strangest thing is, right now hardly anyone seems to care. Commodity
traders cared during June-August when the prices of many commodities
plummeted due to selling pressure stemming from fear of what the tariffs
would do to international trade, but despite the escalating economic war
there are now signs that commodity prices are beginning to recover. Most
notably, the copper price was on the verge of breaking out to the downside
on Tuesday after the announcement regarding $200B of new tariffs, but it
reversed course and rallied. This counterintuitive reaction to news is
preliminary evidence that an intermediate-term bottom was put in place
when the price dropped to $2.55 last month.
A daily close above
$2.76 would be additional evidence that at least a multi-month bottom is
in place.
Platinum Bottom
On Tuesday of this week the
platinum price broke above short-term lateral resistance and closed above
its 50-day MA for the first time since February. This is preliminary
evidence that a sustainable bottom is in place.
That being said, in
each of the past 5 years the platinum price made an important low in
December. Dropping back to below the 50-day MA within the next 2 months
would suggest that another December low was on the cards.
T-Bond Update
The T-Bond price has dropped back to near its May-2018 low. This means
that the T-Bond market is close to breaking out to the downside.
We
expect the T-Bond price to be a lot lower by this time next year, but we
haven't been expecting a downside breakout to happen during
September-October of this year. On the contrary, we've been anticipating a
bear-market rebound.
A bear market rally lasting 2 months or more
remains our favoured short-term scenario for the T-Bond, but the risk of a
sooner-than-expected downside breakout obviously has increased. If the
T-Bond does break out to the downside in the near future it could have a
similar effect on the stock market as the T-Bond's late-January downside
breakout, that is, it could be the catalyst for a sharp stock market
decline.
When will tighter US
monetary conditions start to matter?
The US monetary inflation rate, as indicated on the following chart by
the year-over-year rate of change in US True Money Supply (TMS), has been
near the bottom of its 20-year range since the middle of last year, but
the economy still seems to be doing fine and nothing bad has happened to
the stock market. With the monetary inflation trend showing signs of
having turned upward early this year, in the current cycle has the US
sidestepped the painful effects of rapid money creation and seamlessly
transitioned from one credit-fueled boom to another? Putting it another
way, is it different this time?
Although "it's different this time" is reputed to be the financial
world's most dangerous phrase, to some extent it's always different. In
particular, although creating a lot of money out of nothing inevitably
leads to major problems, the problems will manifest in different ways and
at different times depending on a) how/where the new money is injected, b)
the domestic economic and political situations and c) what's going on in
other parts of the world.
In one respect the current cycle has been
very different in that the Fed has been directly responsible for a large
proportion of the US$ creation. Normally the Fed creates no money
directly, but acts as a backstop for the money creation of the commercial
banks.
This difference is huge. It means that during the current
cycle the bulk of the new money entered the economy via the financial
markets instead of the way it traditionally enters -- via loans to
businesses and individuals. This is why the post-2011 boom has been far
more evident in the stock market than the real economy. Also, it could be
why, this time around, there is a much longer-than-usual gap between the
tightening of monetary conditions and the effects of the tightening
becoming obvious in prices and economic statistics.
Just to be
clear, there is no chance that the US economy and financial markets will
escape the painful knock-on effects of the rapid money-supply growth of
2009-2016, but it's possible that over the next 6 months it will seem as
if it has. That's especially so if the Fed puts its rate-hiking on hold
due to concerns about an inverted yield curve.
As mentioned in
previous commentaries, if at this late stage of the economic expansion the
Fed were to become more concerned about the flattening yield curve than
about "price inflation", a consequence could be a sort of inflationary
blow-off during 2019-2020. That's a scenario in which it would be a bad
idea to be short anything except bonds.
Returning to the question
of when the tighter US monetary situation will start to matter, it matters
right now because it is part of the reason that the yield curve is close
to inversion. As such, it could prompt a premature end to the Fed's
rate-hiking campaign. And if this were to happen within the next few
months it could lead to the superficial effects of inflation becoming less
evident in the stock market and a lot more evident in the commodity
markets and the CPI.
The Stock Market
The S&P500 Index (SPX) managed
to get through the first three days of this week without doing anything
significant. Something significant would be closing above the all-time
high achieved last month (2917) or closing below support at 2870.
Gold and the Dollar
Gold
Over the first three days of this week the US$ gold price oscillated in a
narrow range around its 20-day MA. The price action was not significant.
Gold must break above $1220 to provide the next piece of evidence that
a meaningful rally has begun. Achieving such a breakout would suggest a
short-term target of around $1280. Gold must also avoid closing a day
below $1190, as that would warn that a decline to a new low for the year
was underway.
It's likely that moving up to around $1280 is the best that gold will
be capable of as long as the fundamental backdrop remains bearish,
although there is one way that a sizable rally in the US$ gold price could
occur in the face of an overall-bearish fundamental situation. It could
occur in response to US$ weakness.
A gold rally that was driven
solely by weakness in the US$ would involve a tradable upward move in US$
terms and minimal strength in terms of most other major currencies. It
also would involve weakness in gold relative to many other commodities.
Gold Stocks
In the latest Weekly Update, we
wrote:
"GDX's price action over the final two days of last week
didn't provide much in the way of new information. As illustrated below,
there was a touch of the 20-day MA on Thursday and then a minor pullback.
Additional information will be provided early this week, in that IF a
multi-month bottom is in place then the rally should resume within the
next two trading days without a significant extension of the pullback from
last Thursday's high."
The rally resumed immediately and on
Wednesday 19th September GDX achieved a solid daily close above its 20-day
MA. The next resistance of significance is defined by the late-August
rebound high ($19.50) and the 50-day MA. These resistance levels probably
will be tested within the next several days, although we won't be
surprised if there is some 'corrective' action during the next 1-2 days.
At this stage we aren't expecting more from the gold-mining sector
than a 1-3 month rebound to resistance*, but we will continue to take the
evidence as it comes. A larger and longer rally is possible, but only if
there is a substantial improvement in gold's true fundamentals.
*For GDX, the maximum that would be accomplished by a counter-trend
rebound is a test of intermediate-term resistance near $21.
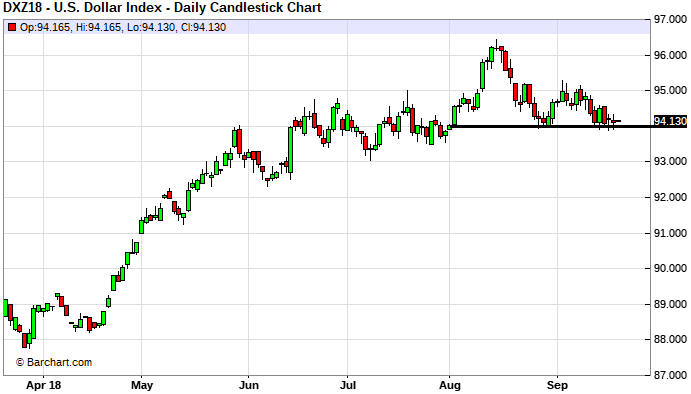
The Currency Market
The first of the following
charts makes it look like the Dollar Index (DX) broke out to the downside
on Tuesday 18th September, but this is just a quirk of the Stockcharts.com
system. Stockcharts shows the nearest futures contract and when one
contract is about to expire it automatically switches to the new nearest
contract. This switching from a nearer to a later contract causes price
gaps to appear in the chart that don't reflect the actual trading. For
example, on Tuesday the Stockcharts.com system stopped showing the
September contract (DXU) and started showing the December contract (DXZ)
on the $USD chart, resulting in a misleading price decline on the chart
due to the December contract being about 0.4 points below the September
contract. In this case, switching from one contract to the next
transformed a 0.15-point daily gain in the market price into a 0.26-point
daily loss on the chart.
This is not a defect in the Stockcharts
system; it's just the way that charts based on the nearest futures
contract work. It's something to be aware of when looking at futures-based
price charts that span multiple contracts.
At this stage there has
been no downside breakout in the DX. For the December contract (the
current nearest futures contract), the important nearby support lies at
94.0.
The technical 'line in the sand' is more clearly defined for the euro
than for the DX. In the euro's case it looks like the 'neckline' of a
well-defined H&S bottom is around 117.50.
Updates on Stock Selections
Notes: 1) To review the complete list of current TSI stock selections, logon at
http://www.speculative-investor.com/new/market_logon.asp
and then click on "Stock Selections" in the menu. When at the Stock
Selections page, click on a stock's symbol to bring-up an archive of
our comments on the stock in question. 2) The Small Stock Watch List is
located at http://www.speculative-investor.com/new/smallstockwatch.html
Chart Sources
Charts appearing in today's commentary
are courtesy of:
https://stockcharts.com/
https://www.barchart.com/
![]()