|
- Interim Update
19th November 2014
Copyright
Reminder
The commentaries that appear at TSI
may not be distributed, in full or in part, without our written permission.
In particular, please note that the posting of extracts from TSI commentaries
at other web sites or providing links to TSI commentaries at other web
sites (for example, at discussion boards) without our written permission
is prohibited.
We reserve the right to immediately
terminate the subscription of any TSI subscriber who distributes the TSI
commentaries without our written permission.
US
Monetary Inflation Update
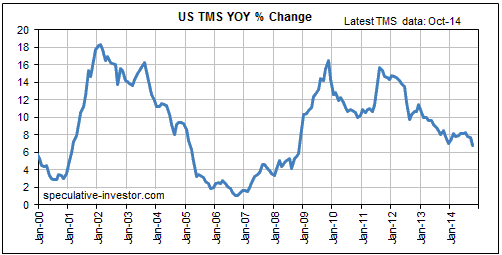
Based on the October month-end monetary data published by the
Fed late last week, the year-over-year (YOY) rate of change in US
True Money Supply (TMS) has just dropped to its lowest level since
December-2008. It is still comfortably above the levels that
preceded the recessions and/or financial crises of the past 15
years, but it can no longer be viewed as supportive for the US stock
market. Furthermore, given that the 6-month TMS growth rate is lower
than the 12-month growth rate and that the 3-month growth rate is
lower than the 6-month growth rate (US TMS has increased at an
annualised pace of only 3.7% over the past three months) and that
the Fed has temporarily stopped creating money out of nothing, the
US monetary inflation rate looks set to fall further over the months
immediately ahead.
The Stock Market
The S&P500 appears to be bullet-proof, but it also appeared to
be bullet-proof prior to the start of a sharp multi-week decline in
late-September.
As was the case prior to the start of the September-October decline, there are
some significant bearish divergences at the moment. For example, while the
S&P500 has been making new all-time highs on almost a daily basis, the NYSE
Composite and Russell2000 Indices have reversed lower from below the highs made
during the third quarter of this year. For another example, only a relatively
small number of individual stocks have been confirming the new highs in the
senior indices. In fact, more NASDAQ-traded stocks made new 12-month lows than
made new 12-month highs on Wednesday 19th November. For a third example,
high-yield bond funds such as HYG and JNK, which normally trend in the same
direction as the stock market, are showing signs of rolling over to the downside
from comfortably below their July-September highs.
We are anticipating a sharp 2-4 week decline in the US stock market, but it is
obviously taking longer than expected to get underway.
Gold and the Dollar
Gold
Revisiting the Goldman Sachs $1050/oz gold forecast
At the beginning of this year, banking behemoth Goldman Sachs (GS) called for
gold to end the year at around $1050/oz. We didn't agree with this forecast at
the time and still believe it to be an unlikely outcome (although less unlikely
than it was a few months ago), but earlier this year we gave Goldman Sachs
credit for at least looking in the right direction for clues as to what would
happen to the gold price. In this respect the GS analysis was/is vastly superior
to the analysis coming from many gold-bullish commentators.
Here's what we wrote when dealing with this topic back in April*:
"GS's analysis is superior to that of many gold bulls because it is focused
on a genuine fundamental driver. While many gold-bullish analysts kid themselves
that they can measure changes in demand and predict prices by adding up trading
volumes and comparing one volume (e.g. the amount of gold being imported by
China) to another volume (e.g. the amount of gold being sold by the mining
industry), the GS analysts are considering the likely future performance of the
US economy.
The GS bearish argument goes like this: Real US economic growth will accelerate
over the next few quarters, while interest rates rise and inflation expectations
remain low. If this happens, gold's bear market will continue.
The logic in the above paragraph is flawless. If real US economic growth
actually does accelerate over the next few quarters then a bearish view on the
US$ gold price will turn out to be correct, almost regardless of what happens
elsewhere in the world. The reason the GS outlook is probably going to be wrong
is that the premise is wrong. Specifically, the US economy is more likely to be
moribund than strong over the next few quarters. It's a good bet that inflation
expectations will remain low throughout this year, but real yields offered by US
Treasuries are more likely to decline than rise due to signs of economic
weakness and an increase in the popularity of 'safe havens' as the stock market
trends downward."
We were right and GS was wrong about interest rates, in that both nominal and
real US interest rates are lower today than they were in April. However, it is
certainly fair to say that GS's overall outlook as it pertains to the gold
market has been closer to the mark than our own over the intervening period.
This is primarily because economic confidence has risen, which is largely due to
the continuing rise in the senior US stock indices.
So, regardless of whether or not gold ends up getting closer to GS's $1050/oz
target before year-end, we give GS credit for being mostly right for mostly the
right reasons over the course of this year to date.
For their part, many gold bulls continue to look in the wrong direction for
clues as to what the future holds in store. In particular, they continue to
fixate on trading volumes, seemingly oblivious to the fact that for every
net-buyer there is a net-seller and that the change in price is the only
reliable indicator of whether the buyers or the sellers are the more motivated.
*The 16th April Interim Update
Gold versus the CPI
Like old soldiers, old beliefs never die. In the financial world, one of the
many old beliefs that hangs on despite a pile of conflicting evidence is the one
about gold being a hedge against, or a play on, so-called "CPI inflation".
The belief that big moves in the gold price are primarily driven by "price
inflation" as measured by the CPI was spawned by what happened during 1972-1982.
As illustrated by the following chart, there was a strong positive correlation
between the gold price and the 12-month rate of change in the CPI during this
period. However, the chart also shows that the positive correlation of 1972-1982
did not persist over the subsequent 32 years. Furthermore, it shows that the
most recent two multi-year rallies in the gold price (the rallies that began in
early-2001 and late-2008) had nothing to do with "CPI inflation". These rallies
got underway in the midst of steep declines in the CPI's growth rate and were at
no time supported by a rapidly-rising CPI.
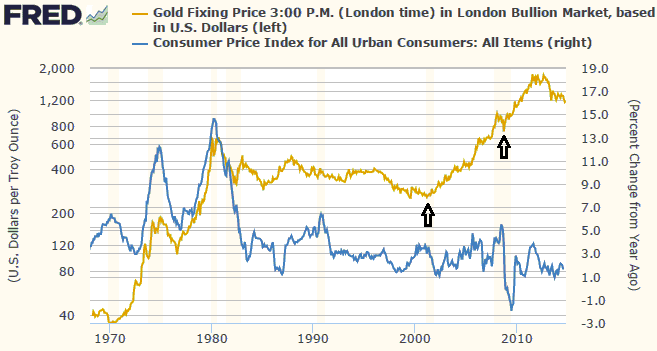
All substantial gold rallies are about falling confidence in the monetary
authorities. The fall in confidence can be associated with so-called "price
inflation", but it certainly doesn't have to be. As was the case with the
substantial gold rallies that began in 2001 and 2008, it can be associated with
stock market weakness, economic recession and minimal "price inflation".
At some point within the next 10 years there will probably be a multi-year rally
in the gold price that is linked to a large rise in the CPI, but, like the most
recent two examples, we expect that the next multi-year gold rally will have
very little to do with "CPI inflation". Instead, we expect that it will be set
in motion by either a major top in the US stock market or by the US stock market
topping relative to other stock markets if not in nominal terms. That the
S&P500's upward trend has extended much further than we thought it would, in
both nominal terms and relative to other important global equity indices, is the
main reason we've been early (that is, wrong) on the gold market.
Why GLD's bullion inventory follows the gold price
This is a topic we've dealt with several times in TSI commentaries over the
years, and earlier this week we dealt with it at the TSI Blog. Here's the link:
http://tsi-blog.com/?p=1135
Current Market Situation
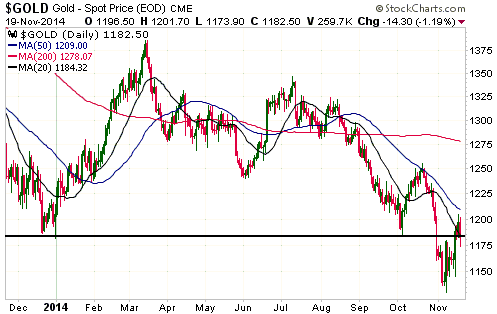
The US$ gold price put some distance between itself and support/resistance at
$1180 (+/- $2) on Tuesday, but then dropped back to the major demarcation level
on Wednesday. We suspect that this will prove to be a successful test of the
preceding upside breakout. If so, there could be some additional minor weakness
over the next 1-3 trading days, but gold should hold above $1170 on a daily
closing basis.
Our expectation continues to be that gold will move up to $1210-$1240 within the
next 2-3 weeks.
At this stage we think that gold has little chance of making a solid break above
$1250 before year-end, but that it will do so during the first quarter of next
year. As always, however, what gold does will be determined to a large extent by
what happens in other financial markets, with the US stock market being the most
influential at the moment. It will not be determined by changes in the volume of
gold flowing into China or India.
Gold Stocks
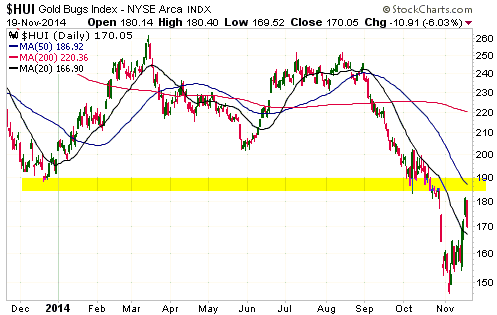
In response to Tuesday's market action we published a brief
post at the TSI Blog to make the
following points:
1) GDXJ had reached the resistance range that defined the most realistic upside
target for the initial rally from its crash low, and the HUI was close to doing
the same.
2) GDXJ had just achieved three consecutive up-days for the first time in more
than five months.
The first point was a warning not to expect much additional upside in the
immediate future, whereas the second point was a sign that the current rally
could evolve into something substantial.
The gold sector's sharp pullback on Wednesday could mean that the HUI's initial
rally ended about 4 points shy of its target range and that a decline to test
the crash low, propelled, in part, by the second and final round of tax-loss
selling, is now underway. However, it's more likely that a brief (2-4 day)
consolidation will be followed by a rise to a new multi-week high before the
start of a testing decline.
The Currency Market
There has been a strong positive correlation between the US$ gold price and the
Yen for a few years now. Furthermore, the positive correlation became even
stronger over the past five months, with every ripple in one of these markets
being mimicked by the other market. At least, that was the case until two weeks
ago, when gold turned higher while the Yen continued to slide. Therefore, we now
have a potentially significant divergence on our hands.
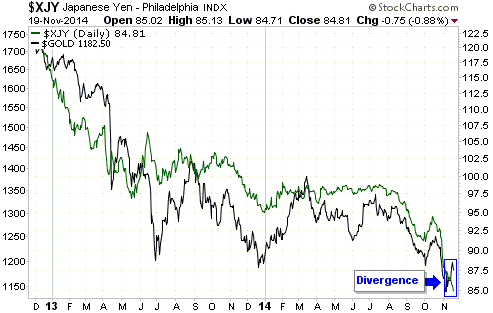
The Yen-gold relationship suggests that either gold is about to re-enter its
downward trend or the Yen is about to reverse upward. As was the case at the
lows in June-July and again in December of last year, we think that gold is
leading and that the Yen will soon turn upward.
News that Japan's economy has drifted back into recession probably contributed
to this week's extension of the Yen's decline, although this information really
shouldn't be considered news. The most interesting aspect, to date, of another
negative GDP print for Japan has actually been the abject refusal of most
economists, financial journalists and other commentators on financial matters to
view the confirmation of economic weakness as evidence that Keynesian strategies
don't work. Rather than even begrudgingly acknowledging the possibility that the
"stimulus" hurt more than it helped, all of the problems in Japan's economy are
now being laid at the feet of the April-2014 consumption tax increase. Brushed
aside are the facts that the Japanese economy contracted by just as much in the
fourth quarter of last year as it did in the third quarter of this year and that
the economic well-being of the average Japanese salary-earner is lower today
than when Prime Minister Abe began to implement his aggressive new stimulus
measures in early-2013.
Updates
on Stock Selections
Notes: 1) To review the complete list of current TSI stock selections, logon at
http://www.speculative-investor.com/new/market_logon.asp
and then click on "Stock Selections" in the menu. When at the Stock
Selections page, click on a stock's symbol to bring-up an archive of
our comments on the stock in question. 2) The Small Stock Watch List is
located at http://www.speculative-investor.com/new/smallstockwatch.html
 Kinross
Gold (KGC) trade exited Kinross
Gold (KGC) trade exited
In the 5th November Interim Update a short-term trading position in KGC was
added to the TSI Stocks List at US$2.08 (initially US$2.00, but adjusted up to
$2.08 to reflect the opening price of the stock on 6th November). The aim was to
catch a quick rebound in an extremely oversold and under-valued stock.
In the 10th November Weekly Update we said that the position would be
automatically exited if KGC traded at US$2.90, which it did on 18th November.
For TSI record purposes, this trade has therefore been closed. The result was a
profit of about 40%.
Chart Sources
Charts appearing in today's commentary
are courtesy of:
http://stockcharts.com/index.html
http://research.stlouisfed.org/

|
