|
- Interim Update 19th December 2007
Copyright
Reminder
The commentaries that appear at TSI
may not be distributed, in full or in part, without our written permission.
In particular, please note that the posting of extracts from TSI commentaries
at other web sites or providing links to TSI commentaries at other web
sites (for example, at discussion boards) without our written permission
is prohibited.
We reserve the right to immediately
terminate the subscription of any TSI subscriber who distributes the TSI
commentaries without our written permission.
TSI Vacation Reminder
Just a reminder that we'll be on vacation from 21st through to 30th
December, inclusive, so there will be no Weekly Update on Sunday 23rd
December, no Interim Update on Thursday 27th December, and no Weekly
Update on Sunday 30th December. We plan to send out a brief update via
email on Monday 31st December, but the next full report will be the
Interim Update on the 3rd of January.
Very best wishes for a fun-filled, healthy and safe Holiday Season, and
thank you for your support during what turned out to be an unusually
challenging 2007.
Uranium Update
We are nowhere near as confident about the sustainability of the
uranium bull market as we are about the sustainability of the gold bull
market. There are simply a lot more things that could go wrong with a
long-term investment in uranium than with a long-term investment in
gold.
In order for gold to maintain its upward trend and rise to a few
thousand dollars per ounce, all we need is for central banks and
governments to continue along their current inflationary paths. This,
in our view, is a 'no brainer' because with so much debt in the world
the governments and their banks have no politically-feasible
alternative. The only question is the route that will be taken by gold
over the next several years in the journey from its current price to a
multiple of its current price.
We would therefore give a MUCH higher weighting to gold equities than to uranium equities in an investment portfolio.
Having said that, the uranium sector possibly offers the stock market's
best SHORT-term risk/reward ratio because uranium stocks have been
beaten down as much as financial stocks over the past six months and
yet the fundamental backdrop for the uranium-mining business remains
bullish. In fact, the uranium sector is in such a depressed state right
now that in-ground uranium can literally be purchased for almost
nothing. We say this because the current market capitalisations of some
exploration-stage uranium miners with proven in-ground resources are
only slightly greater than the amount of cash these companies have in
the bank. Mongolia-based Khan Resources (TSX: KRI) and Western
Prospector (TSXV: WNP) are good examples.
Investors are obviously (and rightly) leery about Mongolia's political
risk, so in this respect the cheapness of KRI and WNP is somewhat
understandable. Note, though, that these stocks would look ridiculously
cheap at their current prices even if we assumed the worst (the worst
being that the Mongolian government steals 50% of the companies'
projects). And anyway, it's not only the uranium juniors burdened with
substantial country risk that have been sold down to bargain-basement
levels. Case in point: Energy Fuels (TSX: EFR), a member of the TSI
Stocks List and a company that was written up in a Mineweb.com article earlier this week.
At Wednesday's closing price of C$1.18, EFR had an enterprise value
(market capitalisation minus net cash) of only C$30M. This is a company
that plans to commence uranium mining next year and to have low-cost
annual production of around 2M pounds (equivalent to annual revenue of
$180M at the current uranium price) three years from now.
Why does EFR have such a low valuation? Well, in addition to the
ultra-depressed investor sentiment afflicting the uranium sector and
the effects of tax-loss selling, we suspect it's because the market
doesn't understand the EFR story.
Most exploration-stage companies spend many years and tens of millions
of dollars proving up in-ground resources. Even though these in-ground
resources often don't get developed to the point where they translate
into actual profits, they are what the valuations of junior resource
companies are most commonly based on. EFR, however, is taking a very
different path. Rather than using up years of precious time and huge
amounts of shareholder funds proving-up resources they already know
exist, EFR's senior managers have put the company on a fast track to
production and profits. This makes EFR a real business, but means that
the company rarely reports the sort of exploration-related news that
tends to grab the stock market's attention.
People interested in positioning themselves for a potential recovery in
the uranium sector, but who aren't comfortable with the juniors, could
consider taking a position in Uranium One (TSX: SXR), a mid-tier
uranium producer, and/or Cameco (NYSE: CCJ), the world's largest
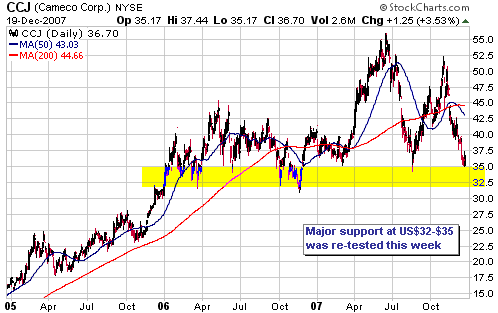
uranium producer. The following chart shows that CCJ has just bounced
off major support. We won't be surprised if this support is breached at
some point over the coming 12 months, but a rebound is a likely
short-term outcome.
The Stock Market
Current Market Situation
We are short-term bullish on the US stock market on the expectation
that the pullback from the early-December high will be followed by a
tradable advance during the first few months of 2008. Note, though,
that this view is predicated on the market holding above the November
low.
If the S&P500 broke its November low it would be a significant
bearish development because it would mean that the most important US
stock market index had not only breached short-term lateral support,
but also dropped below the bottom of the long-term channel drawn on the
following chart. We would therefore not maintain our positive outlook
if that were to happen. Specifically, our short-term bullish view will
be 'stopped out' if the S&P500 Index closes below 1400.

Gold and
the Dollar
Gold
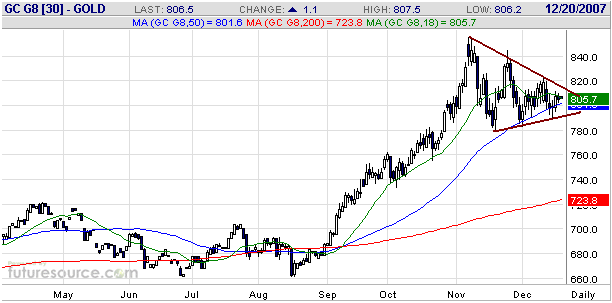
After reaching an 'overbought' extreme in early November gold has
consolidated in a fairly normal fashion. As indicated on the following
daily chart of February gold futures, this consolidation appears to be
taking the form of a triangle.
Our view is that the
Dollar Index has begun a multi-month bottoming process that will entail
one or two tests of the November low and during which rallies will
likely be capped by former long-term support (now resistance) at 78-80.
If this view is close to the mark then the Dollar Index's current
rebound is at least two-thirds complete and the short-term downside
pressure being applied to gold by US$ strength will soon abate. And if
so then gold should do no worse than test support at $780 prior to
embarking on its next short-term upward trend.
We remain short-term "bullish" on gold, but will immediately downgrade
this view a single notch if the February gold futures contract takes
out $780 on a daily closing basis.
Silver
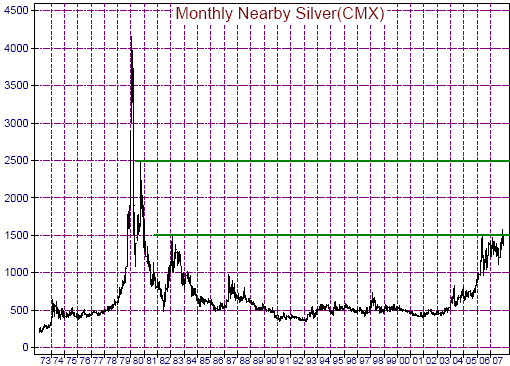
We thought we'd take a quick look at silver's "big picture" in today's
report, via the following monthly chart (the chart is courtesy of www.mrci.com).
The chart shows the long-term resistance at $15 that capped the
2005-2006 rally and that appears to have capped the 2007 rally. Once a
decisive break above $15 occurs the logical intermediate-term objective
will be $25.
In our opinion there's a very high probability that a
decisive/sustained break above $15 will occur within the next 18
months, but a low probability that it will occur within the next 3
months.
Gold Stocks
Re-visiting an old scenario
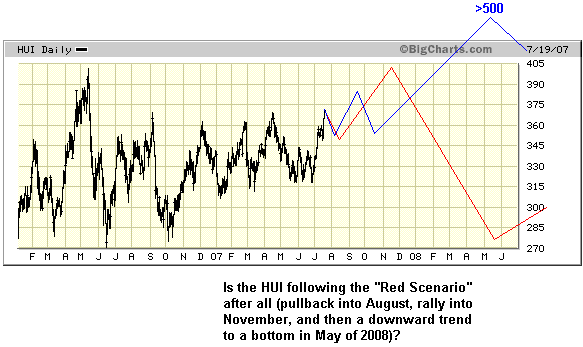
The following chart (minus the note at the bottom) originally appeared
in our 23rd July commentary and shows the two potential scenarios we
had in mind for the AMEX Gold BUGS Index (HUI) at that time. We are
dragging it out again now because the "Red Scenario" -- the one
represented by the red line on the chart -- remains relevant, even
though the market did a good job of convincing us otherwise.
We all but gave up on
the "Red Scenario" because two things happened that should not have
happened if this scenario were really 'in play'. First, the pullback
from July's short-term peak resulted in a new low for the year, which
it should not have done if the "Red Scenario" was applicable. Second,
the rally from the August low to the November peak should, at best,
have resulted in a test of the May-2006 peak, but it ended up taking
the HUI 15% above its May-2006 peak. Again, this should not have
happened. However, putting aside August's false downside breakout and
the potentially false upside breakout that occurred during
October-November, on a purely directional basis the HUI's performance
since its July peak has been totally consistent with the "Red
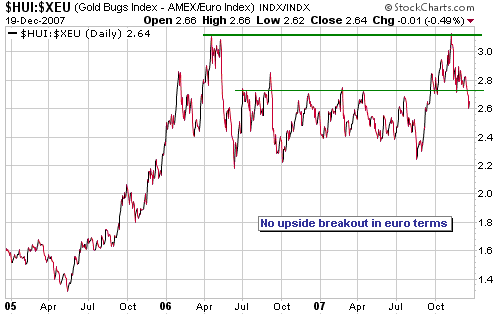
Scenario". Furthermore, the following chart of the HUI/euro ratio shows
that in terms of a relatively strong currency there was no upside
breakout during October-November.
In the next section
we mention an indicator that could soon tell us whether or not
something along the lines of our old "Red Scenario" is the most likely
outcome. Note, though, that a decline from the November-2007 peak to a
bottom around May of next year would not occur in a straight line. As
discussed in the latest Weekly Update, a short-term bottom during
December or January would probably be followed by a 1-2 month rebound
and then a drop to the ultimate low.
Trying to fit the pieces together
One of the things that has made the past six months such a challenge is
that the pieces of the inter-market puzzle have not fitted well
together. At least, that's the way it has seemed to us.
From our perspective the main issue has revolved around the US dollar's
anticipated performance relative to the euro. Over the past few months
the US$ has been dramatically under-valued and oversold relative to the
euro, convincing us that an intermediate-term advance in USD/EUR was on
the cards. At the same time, however, gold's fundamentals and price
action were unequivocally bullish, and the definitive breakout by the
AMEX Gold BUGS Index (HUI) in October seemed to suggest that the gold
sector of the stock market had embarked on a new major upward leg in
its long-term bull market. This created a quandary for us because it
would be unusual, in the extreme, for the gold sector to commence a
major upward leg just prior to an intermediate-term bottom in the US
dollar's foreign exchange value. Both the HUI and gold are quite
capable of rallying during the latter stages of a USD/EUR rally, but
the initial stages of a meaningful US$ rally invariably coincide with
weakness in gold-related investments. We therefore couldn't reconcile
our strongly-held view that the US$ was bottoming with what was
happening on the gold front.
Last week's break below intermediate-term support by the HUI has added
a modicum of clarity to the confusing inter-market picture in that the
HUI is now behaving exactly the way it should IF the US$ has commenced
a bottoming process that will, after a few months, lead to a strong US$
rally. In other words, the HUI has begun to move into line with our
currency market outlook.
The pieces still aren't fitting together particularly well, though,
because gold's intermediate-term fundamentals remain very bullish.
Specifically, powerful trends towards wider yield and credit spreads
have been established, real interest rates are low and falling, and the
positive fundamental backdrop for gold continues to be confirmed by
strength in the monetary metal relative to the industrial metals.
Furthermore, gold's price chart looks bullish in that the decline from
the early-November peak has the appearance of a correction within an
intermediate-term upward trend. Considering how overbought the market
was in early November it was reasonable to anticipate a multi-week
correction back to the vicinity of the 50-day moving average, and a
routine correction back to the 50-day MA is all that has happened thus
far.
One possibility that occurs to us when we attempt to fit the various
pieces together is that the markets will soon come around to the belief
that the worst of the debt crisis is over. If this happens then
interest rate spreads will become narrower, financial stocks will
rebound strongly, Treasury Bonds will begin to trend lower, the US$
will begin to trend higher and gold will probably do no better than
test last month's high before commencing an intermediate-term decline.
Such an outcome would paint the 2007 financial crisis as an elongated
version of the 1998 crisis, making sense of gold's bullish performance
over the past few months whilst being consistent with the idea that a
sizeable US$ rally is close at hand. It would also be a fundamental
justification for the HUI's "red scenario" discussed above.
An alternate possibility is that last week's breakdown in the HUI was
yet another impressive 'head fake' and that the best we can reasonably
expect from the US$ over the coming 6 months is the occasional
counter-trend bounce. If this is the case then the HUI and the gold
price will probably trade above 600 and $1000, respectively, by the
second quarter of next year.
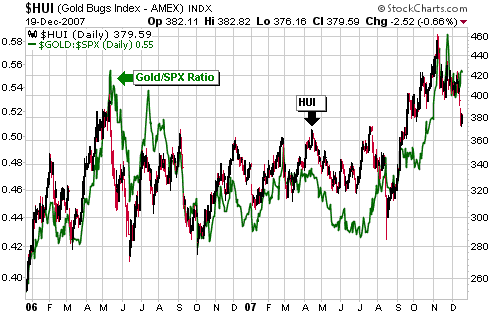
The performance of the gold/SPX ratio -- gold's performance relative to
the S&P500 Index, that is -- should provide us with an important
clue as to which of these very different alternatives is closer to
reality. The reason, as evidenced by the following chart, is that the
HUI and the gold/SPX ratio usually move in lock-step, a relationship
that makes intuitive sense given that there will generally be no reason
for the investing community to increase its demand for gold stocks
unless gold is doing better than the broad stock market. Furthermore,
periods when these two entities move in different directions tend to be
short-lived and divergences tend to be meaningful. For example, it
proved to be significant that the August-2007 plunge in the gold sector
was not confirmed by the gold/SPX ratio.
The current situation is that a) gold/SPX broke out to the upside in
November and then pulled back to just below its breakout level, and b)
the sharp decline in the HUI over the past week was NOT confirmed by
gold/SPX.
The gold/SPX ratio should now either confirm the HUI's breakdown by
moving to a new multi-week low, or remain positive and thus label the
HUI's recent downside breakout as another 'fakeout'.
Current Market Situation
In the latest Weekly Update we wrote:
"Last week's break below
support does not mean that additional weakness will occur in the near
future. However, a significant drop in the HUI over the coming 1-2
weeks would simplify the situation, especially if it occurred alongside
resilience in the gold price. We say this because a quick additional
decline of around 10% in the HUI in parallel with a much lesser
percentage decline in the gold price would most likely cause our
HUI/Gold Oscillator (HGO) to generate a buy signal, potentially setting
the stage for a strong rebound. In other words, significant
follow-through on last week's downside breakout -- a quick drop to the
mid-300s, for instance -- would soon lead to a very good short-term
buying opportunity provided that the gold price continued to trace-out
a routine consolidation pattern.
Additional near-term
weakness could make things easy by setting up a relatively low-risk
buying opportunity, but the markets have recently tended to make things
as difficult as possible (the market environment since July of this
year has been one of the most challenging we've ever had to deal with)
and if they continue to do so then a rebound will begin immediately. A
rebound that began without the HUI first becoming severely 'oversold',
as measured by our HGO or by momentum indicators such as the RSI, would
keep our short-term outlook 'up in the air' and in all likelihood be
capped by former support (now resistance) in the 398-405 range."
When the HUI dropped sharply on Monday in both nominal terms and
relative to the gold price it looked like the market was going to make
things easy by setting up an excellent short-term buying opportunity.
In fact, if Tuesday had been similar to Monday then our HUI/Gold
Oscillator (HGO) would have generated a rare buy signal. Unfortunately,
however, the small rise on Tuesday followed by the even smaller decline
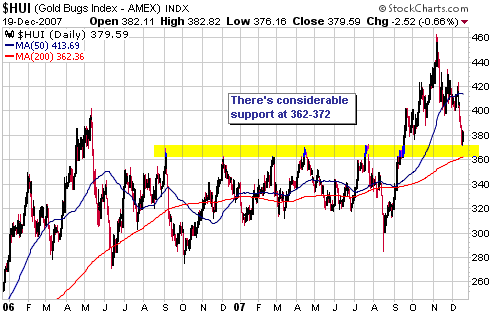
on Wednesday has prevented that from happening. A drop to 350 or lower
between now and year-end is still possible and would set-up the
aforementioned buying opportunity, but it's more likely that the top of
the support range identified on the following chart has limited the
downside for now.
A drop to 350 or lower within the next two weeks will cause us to
immediately upgrade our short-term outlook to "bullish", but failing
that we will probably remain "neutral".
Update
on Stock Selections
(Note: To review the complete list of current TSI stock selections, logon at http://www.speculative-investor.com/new/market_logon.asp
and then click on "Stock Selections" in the menu. When at the Stock
Selections page, click on a stock's symbol to bring-up an archive of our comments on the stock in question)
 Sabina Silver (TSXV: SBB). Shares: 66M issued, 83M fully diluted. Recent price: C$1.66 Sabina Silver (TSXV: SBB). Shares: 66M issued, 83M fully diluted. Recent price: C$1.66
So many junior resource stocks are trading at absurdly low valuations
right now that it is difficult to decide which ones to feature as
candidates for new buying. However, SBB is a standout in that its
Hackett River project located in Canada's Nunavut region has a
Measured-and-Indicated resource containing 205M ounces of silver plus
4.3B pounds of zinc, and yet the company's current enterprise value is
only C$66M (C$110M market cap minus $50M cash). This means that buyers
at Wednesday's closing price of C$1.66 are paying $0.32/ounce for SBB's
silver and getting the zinc for free.
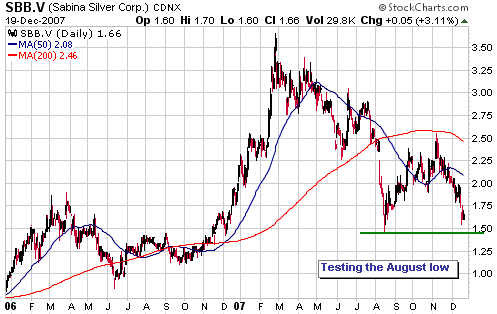
With reference to the following chart, the stock is currently testing
support defined by its August-2007 low. It could remain under pressure
for a few more days due to the remnants of tax-loss selling, but it
should then rebound strongly.
 NovaGold Resources (AMEX and TSX: NG). Shares: 105M issued, 120M fully diluted. Recent price: US$7.39 NovaGold Resources (AMEX and TSX: NG). Shares: 105M issued, 120M fully diluted. Recent price: US$7.39
We added some exposure to NG to our own account earlier this week in
the low-US$6 area and planned to add it to the TSI Stocks List via
today's report, but the darn thing surged 21% on Wednesday. The
long-term risk/reward is very attractive at Wednesday's closing price
of US$7.39, but we will hold off adding it to the TSI List for now in
the hope that it will pullback to $6.50 or lower (we will add it to the
List if it trades at US$6.50 within the coming 4 weeks).
NG traded as high as US$22 last month, but was clobbered due to huge
upward revisions to the capital cost estimates for its Galore Creek
(50/50 JV with Teck) and Donlin Creek (50/50 JV with Barrick) projects.
It now looks like NG's share of the capital costs across both projects
will be around US$4.5B, an amount that will be almost impossible for a
company of NG's size to finance without diluting its current
shareholders into oblivion. But regardless of NG's ability to obtain
sufficient reasonable-cost financing there is enormous option value in
these two massive projects, and if the gold bull market continues then
this value WILL be realised one way or another.
If we are right to believe that gold is now in a long-term upward trend
relative to industrial metals as well as relative to paper currency
then major diversified mining companies such as BHP, Rio Tinto and
Xstrata will probably become interested in expanding their gold-mining
businesses at some point over the next few years. And if so then small
companies with huge in-ground gold resources in politically secure
locations -- NovaGold being a classic example -- will be gobbled up.
The $2B needed to fund 50% of the development budget at the 30M-ounce
Donlin Creek project represents a big obstacle for NovaGold, but it is
pocket change for BHP.
Lastly, it should be kept in mind that NG has assets in addition to
Galore and Donlin. For example, NG's 100%-owned 100K-ounce per year
Rock Creek gold project, scheduled to begin production early next year,
is probably worth around US$200M (almost $2/share).
Chart Sources
Charts appearing in today's commentary
are courtesy of:
http://stockcharts.com/index.html
http://www.futuresource.com/
http://bigcharts.marketwatch.com/

|

