![]()
![]()
![]()
![]()
- Interim Update 19th December 2018
Copyright
Reminder
The commentaries that appear at TSI
may not be distributed, in full or in part, without our written permission.
In particular, please note that the posting of extracts from TSI commentaries
at other web sites or providing links to TSI commentaries at other web
sites (for example, at discussion boards) without our written permission
is prohibited.
We reserve the right to immediately
terminate the subscription of any TSI subscriber who distributes the TSI
commentaries without our written permission.
TSI Christmas and New
Year Schedule
1) There will be a Weekly Update
as usual on this coming Sunday (23rd December).
2) There will be an
abbreviated Interim Update on Thursday 27th December.
3) The Weekly
Update that would have been posted on Sunday 30th December (as per the
normal publishing schedule) will instead be posted on Tuesday 1st January.
This will allow us to incorporate the yearly closing prices into our
discussion/analysis.
4) There will be no Interim Update on Thursday
3rd January.
5) The normal TSI publishing schedule will resume with
the Weekly Update on Sunday 6th January.
The Fed makes its
move
We would feel sorry for the
members of the FOMC if they weren't eager participants in a scheme that
rewards financial engineering, promotes speculation over capital
investment, supports profligate government and impoverishes the middle
class. After all, they are trying to shift interest rates to be either
above, below or equal to a so-called "neutral rate", without having any
way of determining what the neutral rate is. So, they manipulate interest
rates lower until there's an obvious inflation problem or investment
bubble and then manipulate interest rates higher until bubbles burst or
there appears to be a high risk of deflation, all the while pretending
that by considering reams of statistics they can gain special insight into
how short-term credit should be priced.
The latest manipulation
occurred on Wednesday. The Fed predictably hiked its targeted interest
rate by 0.25% and unpredictably failed to soften the blow. The general
expectation was that the impact of this week's rate hike would be lessened
by hinting that the rate-hiking program is nearly complete, but that
didn't happen.
Oil makes the expected new low
After its plunge to an interim
low and a downward momentum extreme in November, the most likely path for
the oil price was thought to involve a multi-week rebound/consolidation
and then a decline to the ultimate correction low. We got a multi-week
rebound/consolidation from late-November through to the end of last week,
and during the first two days of this week we got a quick decline to a new
low for the year.
The pattern is potentially complete. Therefore,
it's possible that this week's low will prove to be the ultimate
correction low, or at least a low that holds for several months.
We continue to like the idea of averaging into the Oil Services ETF
(OIH) during this period of extreme weakness in anticipation of a
multi-month rebound. Note that OIH is influenced by both the oil price and
the stock market. It is not a pure play on oil.
The Stock Market
In reaction to evidence that the
Fed remains committed to its rate-hiking campaign, the S&P500 (SPX) broke
below its Q1-2018 low on Wednesday 19th December.
The NASDAQ100 (NDX), however, remains above its Q1-2018 low. This
potentially is a bullish non-confirmation, although it wouldn't take much
in the way of additional weakness for the NDX to confirm the SPX's
downside breakout.
This week's close will be significant. Will the SPX's weekly close
confirm its daily downside breakout? And will the NDX fall far enough over
the final two days of the trading week to move into line with the SPX?
Almost regardless of how the above questions are answered, there are
signs that the senior US stock indices are close to lows that will hold
for at least a few months.
One sign is that the TSI put/call
indicator (TPCI), which is displayed in the bottom section of the
following daily chart, is now close to its buy zone (>0.80). TPCI buy
signals have a perfect record of marking short-term SPX price lows over
the past 9 years, although the signals could be less timely in a bear
market.
A second and perhaps more important sign is the number of individual
NASDAQ stocks that hit new 12-month lows on Wednesday 19th December.
The red bars on the following chart indicate the number of individual
NASDAQ stocks that made a new 12-month low on each trading day. Except
during the crescendo of the 2008 crisis this number has never been
significantly higher than it was on Wednesday of this week.
There is no evidence in the price action that a meaningful low is in
place and the absence of a VIX surge remains a cause for concern, but we
think it's a good bet that a tradable rebound will soon begin. In fact,
due to the large number of individual stocks that have just made new lows
it's possible that a longer rebound than we were expecting a week ago will
begin within the next few days.
On a separate matter, for those
investors interested in obtaining long-term exposure to agriculture via
the stock market, now would be an opportune time to buy the shares of
Nutrien Ltd. (NTR) and The Mosaic Company (MOS), two of the world's
biggest and best-known fertiliser producers. Both stocks dropped sharply
over the past few weeks in sympathy would the broad market downturn and
are now close to important support levels.
Gold and the Dollar
Gold
The
following daily chart doesn't show the post-Fed down-move. It does show
that the US$ gold price traded slightly above its 200-day MA and hit its
short-term channel top during Wednesday's session.
As we write,
February gold is trading at $1249. Therefore, the post-Fed down-move has
not been significant to date.
Initial support lies at $1240. If
this support is broken on a daily closing basis it will imply that at
least a multi-week top is in place.
Despite the Fed being more 'hawkish' than many traders were
expecting/hoping, the trend towards a more gold-bullish fundamental
backdrop was extended on Wednesday. This is because the Fed's confidence
in the strength of the US economy is no longer shared by many big traders
in the financial markets. It seems that the Fed's refusal to acknowledge
the risk that a cyclical downturn is in the works is, itself, becoming
widely viewed as a risk.
If the fundamental backdrop continues to
shift in gold's favour then the US$ gold price shouldn't do anything more
bearish over the weeks ahead than experience a routine correction.
Gold Stocks
In the
email sent to
subscribers prior to Wednesday's US trading session we noted that both
GDX and the HUI were testing intermediate-term resistance ($21.00 for GDX,
160 for the HUI), and went on to write:
"Our concern is that
while an extension of the short-term rally (with or without some
intervening consolidation) is the most probable outcome, the fact that the
gold-mining indices and ETFs have moved up to test important resistance
levels ahead of the 19th December Fed statement creates the risk of a
post-Fed downward reversal. Therefore, we think it makes sense to do some
hedging.
While we sometimes mention hedging tactics in the TSI
commentaries, we don't recall ever including a pure insurance position in
the TSI List. If so, this is a first. We are adding the GDX March-2019
$19.00 put option to the List solely for hedging/insurance purposes. It
ended Tuesday's session at US$0.34-$0.39 with a last trade at $0.37, so
unless something dramatic happens at the start of trading on Wednesday our
opening price will be $0.37."
What we were concerned about
happened. The gold-mining indices and ETFs moved up to new 2-month highs
during the early part of Wednesday's trading session (creating an
excellent hedging opportunity) and then reversed course. As illustrated
below, on 19th December GDX plunged on high volume from slightly above
intermediate-term resistance and in the process wiped out the preceding
two weeks of gains.
Superficially, Wednesday's price action (a spike above obvious
resistance followed by a high-volume downward reversal) was very bearish.
It should be taken at face value and hedges should be maintained for now,
but there is also a realistic chance that it will prove to be a quick
'shake-out' within an upward trend. That's especially so given that the
fundamental backdrop continues to trend in gold's favour and the Dollar
Index appears to be rolling over to the downside.
The tale will be
told by whether the 50-day MA (for GDX and the HUI) is breached on a daily
closing basis. If it is then we probably are going to get a test of the
September low prior to the start of the next tradable rally.
The Currency Market
The
Dollar Index (DX)
The DX didn't get much of a boost on
Wednesday from the Fed's decision to stay the tightening course. It
managed to reverse an early loss and hold above its 50-day MA, but it
didn't rally. We think it is rolling over to the downside, but it must
close below 95.75 to validate this opinion.
The reason the DX is a lot closer to the bottom than to the top of its
2-month range is that its two main fundamental drivers (the interest rate
differential and relative equity-market strength) have begun to move
against it. Specifically, despite the Fed's on-going commitment to its
tightening program the interest-rate differential began to trend in the
euro's favour (meaning: against the DX) in early-November. Relative
equity-market strength was supportive for the US$ up to early-December,
but over the past 2-3 weeks there has been a meaningful shift in support
of the euro.
The Yuan
Xi
Jinping gave a speech on Tuesday 18th December at an event celebrating the
40th anniversary of China's reform and opening-up. Anyone who was hoping
for a conciliatory speech stressing further opening-up of China's economy
would have been disappointed. Instead, he stressed maintaining Party
leadership over everything. Here are some translated excerpts:
"It
is by upholding the centralized, unified leadership of the Party that we
have been able to achieve the historic transformation, usher in a new era
of reform and opening-up, and embark on a new journey of great
rejuvenation of the Chinese nation."
"The Party must guide
the overall situation and coordinate the work of all sides, remain
committed to practicing scientific, democratic, and law-based
governance..."
"No one is in a position to dictate to the
Chinese people what should or should not be done."
In the
on-going negotiations with the US government regarding trade and other
areas of conflict, it's likely that China's government will offer only
minor concessions or concede to doing things that it was planning to do
anyway. If the stock market maintains a downward trend, minor concessions
may be all it will have to offer to get some sort of deal.
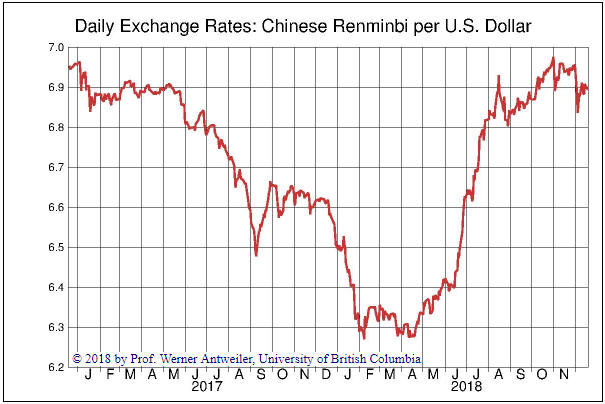
Due to
a pullback in the US$/Yuan exchange rate from major psychological
resistance near 7 (see chart below), the risk posed by weakness in China's
currency has shifted from centre stage over the past month. We think this
will turn out to be a temporary reprieve and that Yuan weakness will be
one of the causes of asset-market instability in 2019.
Updates on Stock Selections
Notes: 1) To review the complete list of current TSI stock selections, logon at
http://www.speculative-investor.com/new/market_logon.asp
and then click on "Stock Selections" in the menu. When at the Stock
Selections page, click on a stock's symbol to bring-up an archive of
our comments on the stock in question. 2) The Small Stock Watch List is
located at http://www.speculative-investor.com/new/smallstockwatch.html
Chart Sources
Charts appearing in today's commentary
are courtesy of:
https://stockcharts.com/
Pacific
Exchange Rate Service
![]()