![]()
![]()
![]()
![]()
- Interim Update 20th February 2019
Copyright
Reminder
The commentaries that appear at TSI
may not be distributed, in full or in part, without our written permission.
In particular, please note that the posting of extracts from TSI commentaries
at other web sites or providing links to TSI commentaries at other web
sites (for example, at discussion boards) without our written permission
is prohibited.
We reserve the right to immediately
terminate the subscription of any TSI subscriber who distributes the TSI
commentaries without our written permission.
The copper market is
performing as expected
In our 31st December commentary,
we wrote:
"We expect the copper price to do well during the
first half of 2019 in response to the extremely low LME copper inventory
level, a rebound in the stock market and the temporary cessation of the
US-China trade war. In fact, the prices of all base metals are set to
rebound over the next few months for the same reasons. However, copper's
price action suggests that a spike to a new 12-month low could precede the
start of a tradable rally."
The copper price spiked to a new
12-month low a couple of days later and then reversed course. This
prompted us to write (in the 14th January Weekly Update) that the bottom
might be in place. We subsequently (in the 6th February Interim Update)
mentioned a minimum short-term upside target of US$3.15.
As
illustrated below, the copper price broke above resistance at $2.87 on
Wednesday 20th February. More important resistance at $2.95-$3.00 is about
to come into play and could halt the advance temporarily, but a short-term
rise to $3.15 or higher remains likely.
The Stock Market
Still uncertain about
whether the long-term trend has changed
The NYSE Composite
Index (NYA) includes all stocks traded on the NYSE, which means that it
includes more than 1900 stocks, while the S&P500 Index (SPX) comprises 500
large-cap stocks. The ratio of these two indices (NYA/SPX) is therefore a
measure of how the overall market is performing relative to the
largest-capitalisation stocks.
The top section of the following
long-term chart shows the NYA/SPX ratio and the bottom section shows the
NYSE Advance-Decline Line (ADL). The performance of the NYA/SPX ratio
suggests that the October-2018 top was very different to the October-2007
top, but similar to the March-2000 top. The ADL, on the other hand,
suggests that the current situation is not similar to the situation around
either of the previous two major tops.
The ADL trended downward for about two years prior to the March-2000
major peak. This indicates that the bull market's final 2-year advance got
progressively narrower. The ADL only trended downward for a few months
prior to the October-2007 major peak, but it continued to trend downward
until the bear market ended in early-2009.
This time around, the
ADL diverged bearishly from the SPX for only a few weeks prior to the peak
and has since risen to a new high. This is a very strange turn of events
IF a bear market began last October.
Perhaps it is different this
time and the ADL's recent rise to a new all-time high is a misleading
signal (a bull trap). We don't know (and neither does anyone else), but
the ADL's rise to a new high has tipped the scales in favour of the
long-term bull market having further to run. If it were to occur, an
extension of the bull market probably would be of greatest benefit to
late-cycle sectors such as consumer staples and commodities.
Bear
market or not, there's a good chance of a significant pullback within the
coming few weeks and a test of the December-2018 low during the second
half of the year.
McClellan Oscillator trumps Put/Call
During the second week of January there was a McClellan Oscillator
(MO) surge to an unusually high level. We explained the potential
implications of this in the 9th January Interim Update, as follows:
"Over the past three trading days the MOs for both the NYSE and
the NASDAQ moved significantly further into 'overbought' territory -- to
at or near 20-year highs. A chart showing the NYSE Composite Index and the
NYSE MO is presented below. The signal is not infallible, but an MO surge
of this magnitude suggests the sort of internal strength that usually is
followed by only minor setbacks over the ensuing few weeks."
Within about a week of the bullish MO surge the TSI Put/Call Indicator
(TPCI) came very close to generating a sell signal. This muddied the
waters. It meant that one reliable indicator was warning of short-term
downside risk at the same time as another reliable indicator was warning
that short-term downside risk was low and that the market probably would
grind upward over the ensuing few weeks.
We now know that the MO
signal was correct. This suggests that when our put/call indicator and the
MO simultaneously reach extremes (something that almost never happens),
the MO signal should be given priority.
The following chart shows
the NASDAQ Composite Index and the NASDAQ MO. Notice that over the past
few weeks the MO has pulled back from its extreme while the market has
moved upward with only minor setbacks.
The MO signal has run its
course, but even so there is no reason to expect more than a 50%
retracement of the December-February rebound prior to a rally to new highs
for the year.
Gold and the Dollar
Gold
For
the past several weeks our expectation has been that the US$ gold price
would test major resistance in the $1360s during the first quarter of this
year. From our perspective the main uncertainty revolved around whether
there would be a correction to as low as $1250 prior to a rise to test the
aforementioned resistance. This uncertainty was expressed as follows in
the latest Weekly Update:
"...the market has been
consolidating/correcting since late-January. The price bounced after
hitting its 20-day MA late last week, which could mean that the correction
is over and that a rise to major resistance in the $1360s has begun.
However, it's just as likely that the correction isn't complete and that a
drop to $1250-$1280 will precede a move up to test the aforementioned
major resistance."
The US$ gold price broke above its
late-January high during the first half of this week, so it looks like the
test of major resistance will happen sooner rather than later.
A test of resistance in the $1360s could involve a slightly lower
high, for example, a downward reversal from the mid-$1350s. It could also
involve a slightly higher high, such as a spike up to the $1380s.
Note that a downward reversal following a spike above resistance would be
more bearish than a downward reversal from below resistance, because then
we would be dealing with a false upside breakout.
Silver
As illustrated below, the US$ silver price has not yet closed above or
traded above its late-January high. Therefore, it is yet to confirm this
week's upside breakout in the US$ gold price. This is not a bearish
non-confirmation, because it is normal for silver to lag gold until the
late stages of a rally. It is simply noteworthy.
We think that
silver stands a good chance of trading up to the low-$17s within the next
few weeks, at which point it would be a short-term sell. It would be a
short-term buy following a pullback to the $15.20s.
Gold Stocks
From the latest Weekly Update:
"Due to the depressed level of the HUI/gold ratio and the
potential intermediate-term 'coiling' patterns evident in the charts of
the gold-stock indices and ETFs, the short-term risk/reward is more
bullish for gold mining than for gold bullion. If GDX and the HUI can
close above their late-January highs then quick-fire additional gains of
10%-20% could be in store. Moreover, last week's price action suggests
that the risk on new long positions could be limited to a few percent by
placing a sell stop slightly below the 14th February low (163 for the HUI,
$21.84 for GDX). The sell stop is critical in this case."
The
HUI and GDX broke above their late-January highs early this week. Here is
a daily chart of the HUI showing the breakout.
The sell stop remains critical as there is no telling when a
significant top will be put in place. For now the stop could be kept
slightly below the 14th February low, but if the HUI closes above 180 then
the stop should be raised to 169.
Shortly after a short-term top is
put in place the top should be confirmed by the HUI/gold ratio.
Confirmation would come in the form of a daily close below the 40-day MA
(the blue line on the following chart).
This is an interesting time
because the position of the HUI/gold ratio is now roughly the same as it
was at the multi-month tops of February-2017, September-2017, January-2018
and July-2018. Additional strength from here will be evidence that despite
the choppy price action of the past several months, the rally from the
September low is not just another counter-trend rebound within the context
of a multi-year decline.
The Currency Market
Almost nothing has
happened in the currency market since the end of last week. The only
comment we'll make is that the euro has been chopping back and forth
within a narrow horizontal range (112-115) for long enough now that there
likely will be significant follow-through in the direction of the eventual
breakout.
Updates on Stock Selections
Notes: 1) To review the complete list of current TSI stock selections, logon at
http://www.speculative-investor.com/new/market_logon.asp
and then click on "Stock Selections" in the menu. When at the Stock
Selections page, click on a stock's symbol to bring-up an archive of
our comments on the stock in question. 2) The Small Stock Watch List is
located at http://www.speculative-investor.com/new/smallstockwatch.html
![]() Stocks
List Review, Part 3
Stocks
List Review, Part 3
A general review of the TSI Stocks
List started with the "Trading Positions" section in the 6th February
Interim Update. The review continued with the "Gold and Silver" section in
the 11th February Weekly Update and concludes today with the "Other
Stocks" section. Here is a brief comment on each of the stocks in this
section:
1) Alkane Resources (ALK.AX) owns the
Tomingley Gold Operation (TGO) in New South Wales. It also owns the Dubbo
Project (DP), which is construction-ready and slated to produce zirconium
(43% by revenue), hafnium (10% by revenue), niobium (17% by revenue) and
REEs (30% by revenue). The TGO has generated a significant amount of cash
for ALK over the past few years, but it always will be a small-scale
operation and as such will never warrant a large stock-market valuation.
The DP, on the other hand, has the potential to generate huge wealth and
is the reason for our on-going interest in ALK.
The company has a
healthy balance sheet, with no debt and cash-plus-investments of around
A$80M. With 506M shares outstanding and a current stock price of A$0.20,
in effect the market is valuing the combination of the TGO and the DP at
only A$20M. This seems absurd, given that the DP's 2018 FS estimated a net
present value of about A$1.2B at current commodity prices and using a
discount rate of 8%.
The seemingly-absurd market valuation can be
explained by the snail's pace at which ALK's management is moving the
Dubbo Project forward. Before construction can commence, offtake
agreements must be put in place and financing must be arranged for the
A$1.3B of up-front capex.
Ideally, financing of the up-front capex
will be achieved by entering a JV with a much larger company. The reason
is that even if it is possible for a small mining company to arrange all
of the financing required to build a substantial mine, it is a high-risk
path to take. The cost overruns that often occur during the construction
phases of large projects generally can be taken in stride by major mining
companies, but can be life-threatening to small companies that have chosen
to 'go it alone'. And even if the small company is able to arrange
sufficient additional financing to cover the overruns, the high cost of
this additional financing probably will crater the stock price. A good
recent example is Nemaska Lithium (NMX.TO), which lost about 45% of its
market value last week after announcing a cost overrun at its
construction-stage mining project.
This might be an unfair
appraisal, but we get the impression that in terms of sorting out the
offtake agreements and construction financing ALK's position today is not
materially different to what it was three years ago. We hope we are wrong
and tangible progress will be demonstrated within the next few months.
The bottom line is that ALK is extraordinarily cheap, but it will stay
that way until/unless a deal is done that enables the DP to move into the
construction phase.
2) Africa Oil (AOI.TO) is like
a fund that owns stakes in oil exploration/production projects in Africa.
It has several assets, but the bulk of its current value (at C$1.20/share,
the market cap is C$565M) is associated with two investments.
The
first of these flagship investments is the company's 25% stake in the
development-stage South Lokichar Basin in Kenya. It is expected that over
the next few years South Lokichar will be developed into a producing oil
field with output of around 100K barrels of oil per day (bopd). The
initial stage is estimated to have total capex of US$2.9B and result in
production of 60K-80K bopd.
The second of these investments is the
soon-to-be-completed acquisition of 12.5% of a company that holds
interests in multiple producing and developing offshore oil fields in
Nigeria. This acquisition will transform AOI from an oil
explorer-developer to a profitable oil producer.
AOI should perform
well over the coming 12 months as long as the oil market is stable or
strong. At this stage we expect a strong oil market during at least the
first half of 2019.
We are comfortable with AOI's progress and
on-going inclusion in the TSI List.
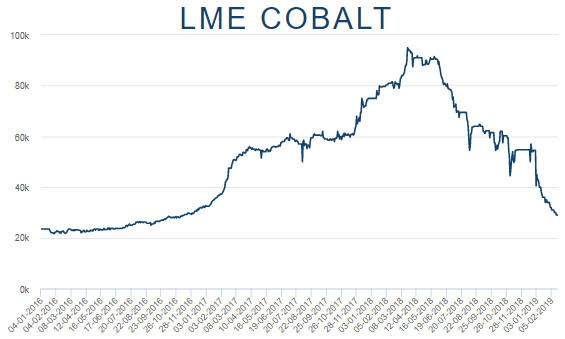
3) Clean TeQ (CLQ.AX,
CLQ.TO) is developing the Sunrise nickel-cobalt-scandium project
in New South Wales (NSW), Australia. When it was added to the TSI List our
suggestion was to buy half a position at around A$1.03 (the price at the
time) and wait for the FS before deciding whether to buy more.
The
results of the FS were published in July and made it clear that CLQ's
project was not as valuable as we thought. Also, the FS showed that the
project's economics were very sensitive to metal prices, which would be a
plus after the metals resumed their bull markets but would work against
CLQ while the cobalt and nickel markets were in correction mode.
We
concluded that it made sense to stay with a half-size position pending
evidence that the cobalt correction had run its course. That evidence
still hasn't arrived. In fact, the cobalt price made a new 2-year low over
the past few days and is down by an incredible 70% from its March-2018
peak. Refer to the chart displayed below for the gory details.
As is the case with Alkane's project, financing of the huge up-front
capex (US$1.5B) for CLQ's Sunrise project ideally will be achieved by CLQ
entering a JV with a much larger company. However, the project would not
be economically viable at current metal prices so the probability is low
that such a deal will be done in the near future.
We are not
comfortable with CLQ. In its favour is a healthy balance sheet (net cash
in excess of A$100M) and a low enterprise value (about A$120M at its
current A$0.31/share price), but it is clear that we should have removed
it from the List as soon as the disappointing FS results were announced.
Despite the large decline in its price it is not a good candidate for new
buying, although there could be a strong rebound in the stock price in
response to strengthening metal markets over the next three months.
4) Energold Drilling (EGD.V) provides drilling
services to the mining and O&G industries. Also, it has begun to diversify
into geothermal drilling as part of an effort to smooth-out the large
seasonal swings in its traditional business. In particular, the goal here
is to boost revenue outside the traditional November-April Canadian
oil-sands drilling season.
EGD's stock market capitalisation is
extremely low relative to the size of its business. This is evidenced by
the fact that it is generating revenue at the rate of about C$90M/year and
has a current market cap of only C$9M (at C$0.17/share). This should
enable EGD's stock price to make a rapid recovery once the market for
junior resource shares turns the corner.
The company also has about
C$17M of long-term debt.
Our main concern with EGD is that its
revenue has been slowly growing for the past 2 years but the revenue
growth hasn't translated into profits and positive cash flow. Instead,
there has been a steady draining of cash from the balance sheet. This is
probably the main reason for the extremely low market valuation.
EGD will be risky until it becomes cash-flow positive, but despite the
risk the stock's risk/reward is very attractive at the current price.
5) Cobalt 27 Capital Corp. (KBLT.V) started out as a
pure play on cobalt via its ownership of physical cobalt (2,983 tonnes a
year ago, about 2,700 tonnes today). It subsequently added a few cobalt
royalties on early-stage projects, but at this point almost all of its
value was still associated with its stash of physical cobalt. Then, in
May-June of last year it did two major cobalt streaming deals. It
purchased cobalt and nickel streams associated with the stake owned by
Highlands Pacific (HIG.AX) in the fully-operational, long-life Ramu
nickel/cobalt project in Papua New Guinea (PNG), and it purchased a cobalt
stream associated with the massive Voisey's Bay nickel mine in Canada.
The timing of the streaming deals was bad, because it turned out that
in May-June of last year the cobalt price was in the early part of huge
decline. Fortunately, however, the Ramu streaming deal fell through and
was renegotiated in January of this year as a takeover of HIG.AX. Due to
the renegotiation, KBLT will end up with slightly more exposure to cobalt
and substantially more exposure to nickel than under the original deal, at
a much lower up-front cost.
KBLT has been severely punished in the
stock market due to the huge decline in the cobalt price and the
substantial downward correction in the nickel price, but its balance sheet
is healthy and the company's management appears to be adequate (management
has made some good moves and some bad moves, but overall it has been
satisfactory). Most importantly, KBLT has transformed itself into the
stock market's premier battery-metals play, so once the cobalt and nickel
prices begin to rebound with conviction there should be a large upward
re-rating of KBLT shares.
If you are going to own only one
battery-metals stock, KBLT should be it.
6) Mineral
Resources (MIN.AX) was added to the TSI List to provide
relatively low-risk exposure to lithium, although it generates most of its
revenue from pit-to-port mining services. The reliable and profitable
mining-services revenue enables the company to pay a significant dividend.
The company's business strategy involves taking part ownership of
exploration-stage projects that it helps to finance through to production.
In most cases its aim is to end up with a life-of-mine service contract
and to sell down its equity stake in the mine, but it retains ownership
stakes in some projects. These projects provide direct exposure to the
prices of iron-ore and lithium.
The company's most valuable single
asset is the Wodgina lithium project in Western Australia's Pilbara
region. MIN and Albemarle (the world's largest lithium producer) are in
the final stages of negotiating a JV on this project. Assuming that the JV
is established as presently agreed between the companies, Albemarle will
pay US$1.15B in cash to MIN in exchange for 50% of the project. This deal
values Wodgina at A$17 per MIN share, making the current price of
A$16.80/share for the entire company seem very low.
We remain
comfortable with MIN and have a 2-year target of A$30/share in mind. It is
the lowest-risk way we know of to obtain exposure to lithium. Our own
account also has lithium exposure via Kidman Resources (KDR.AX), which we
have mentioned a few times in TSI commentaries.
7) Petrus
Resources (PRQ.TO) is a junior Canadian natural gas (NG) producer
with current production of 8,000-9,000 boe/day. Its current market cap is
only about C$25M, which is extremely low relative to its production and
assets. However, it is also carrying a debt burden of about C$140M, so its
enterprise value is much greater (about C$165M).
PRQ's financial
performance depends to a large extent on the price of NG in Canada. As
illustrated by the following chart, over the past 2 years the Canadian NG
price has oscillated at a very low level -- from close to zero to around
$3.00/GJ. It presently is near the top of this range, but it will have to
make a sustained move to much higher levels to have a big effect on PRQ. A
sustained move to much higher levels eventually will occur due to
increasing liquefied natural gas (LNG) demand from China and Japan, but
the timing is unknowable.
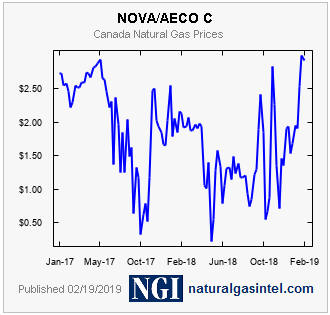
Chart source:
https://www.naturalgasintel.com/
Although it isn't in the TSI
Stocks List, in the current market we would opt for Peyto Exploration
(PEY.TO) over PRQ.TO for new NG-focused buying. PEY's market value has
fallen by almost as much as PRQ's over the past three years and PEY is
better positioned to ride out whatever remains of the Canadian NG bear
market.
Note that in an effort to take more control over their own
destiny, PEY and nine other Canadian NG producers
recently formed a consortium with the aim of building a new LNG export
terminal on Canada's west coast.
8) Tinka Resources (TK.V)
owns the Ayawilca exploration-stage zinc project in Peru. The project has
both the size (the current resource estimate includes 7.4 billion pounds
of zinc) and grade (the average zinc grade is about 6%) going for it.
Also, it is in a relatively low-risk jurisdiction. Therefore, there's a
good chance that TK eventually will be bought be a much larger company.
Our hope is that the takeover bid will come after the stock price has
already moved much higher.
The first look at Ayawilca's economics
should arrive via a PEA in the second quarter of this year.
At its
current price of C$0.31/share, TK's market cap is about C$80M. It
potentially will be valued at a multiple of this within the coming two
years.
Chart Sources
Charts appearing in today's commentary
are courtesy of:
https://stockcharts.com/
https://www.lme.com/
![]()