![]()
![]()
![]()
![]()
- Interim Update 20th April 2016
Copyright
Reminder
The commentaries that appear at TSI
may not be distributed, in full or in part, without our written permission.
In particular, please note that the posting of extracts from TSI commentaries
at other web sites or providing links to TSI commentaries at other web
sites (for example, at discussion boards) without our written permission
is prohibited.
We reserve the right to immediately
terminate the subscription of any TSI subscriber who distributes the TSI
commentaries without our written permission.
Monetary Inflation
Update, Part 2
In the latest Weekly Update we
dealt with the monetary inflation rates of the G2 (the US plus the euro-zone),
Japan and Australia. In today's report we'll cover Canada, Brazil, Hong Kong and
China.
The Bank of Canada (BOC) doesn't provide sufficient data to enable the
calculation of TMS (True Money Supply), so for the following chart we used what
the BOC calls M1++. This should hopefully be good enough and is certainly better
than nothing.
The chart shows that Canada's rate of monetary inflation oscillated between 6%
and 10% over the past 5 years. Over the past 12 months it has risen from the
bottom to near the top of this range, which suggests that monetary conditions
are loosening and that the BOC is more worried about boosting economic activity
than dampening the real-estate speculation that has reached epic proportions in
some parts of the country.

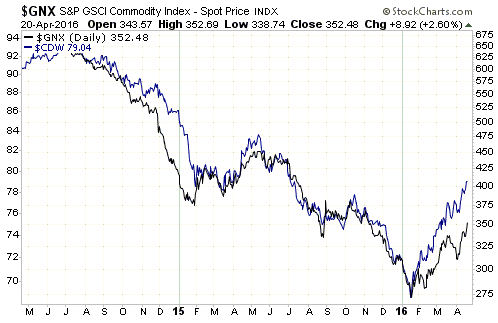
As is the case with the Australian dollar, the Canadian dollar's rate of
exchange against the US$ is influenced to the greatest extent by what's
happening in the commodity markets. This is clearly illustrated by the following
chart, which shows the C$ and the Goldman Sachs Spot Commodity Index (GNX). The
rate of domestic money-supply growth will, however, have a big effect on prices
within the domestic economy.
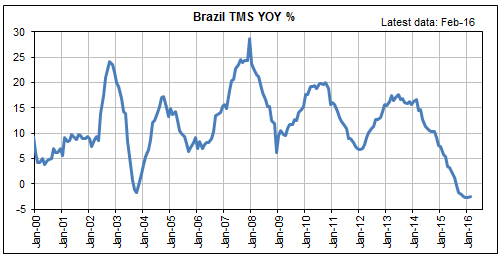
In Brazil, the central bank continues to fight the last war and ignore the
current reality. It is attempting to combat the high level of "price inflation",
but this price inflation is just a lagged effect of the rapid monetary inflation
that occurred years ago. The current reality is 6 months and counting of
monetary deflation, which is bound to result in "price deflation" in the future
if it persists for much longer.
Price deflation is good if it is the result of increasing productivity, but in
Brazil's case it would be symptomatic of a very weak economy and would
undoubtedly lead to another burst of aggressive money-pumping in a
counter-productive effort by the central bank to compensate.
The next chart shows that since mid-2014 Hong Kong's year-over-year (YOY) rate
of M2 growth has fallen from around 16% to around 5%. However, the growth rate
of the narrower M1 money supply peaked at more than 27% a year ago and is still
motoring along at close to 16%, which suggests that the central bank is still
'keeping its foot on the monetary gas pedal' despite Hong Kong having the
world's most expensive real estate market.
One of Hong Kong's biggest problems is the US$ peg that the government insists
on maintaining. Keeping this peg in place requires Hong Kong's monetary policy
to closely track US monetary policy, which sometimes -- such as over the past
few years -- prompts the Hong Kong Monetary Authority to do the opposite of what
it would be doing if its decisions were based primarily on domestic
considerations.
The pronounced slowdown over the past 18 months in the M2 growth rate suggests
that even with the importation of inappropriately-easy US monetary policy, HK's
consumers and property speculators are close to 'peak debt'.
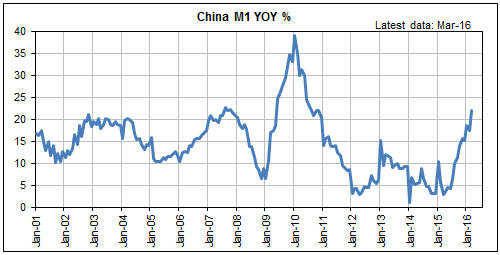
Due to China's influence on the global economy, the last of our monetary
inflation charts is probably the most interesting.
Despite all the talk about the re-balancing of China's economy, the following
chart shows that over the past 12 months China's YOY rate of M1 growth has
rocketed from below 5% to above 20%. This tells us that China's government has
effectively 'thrown in the towel' on economic stability and has returned to its
strategy of promoting new credit-fueled mal-investment in an effort to mask the
adverse effects of previous credit-fueled mal-investment.
This is part of the reason for the broad-based revival in the commodity markets.
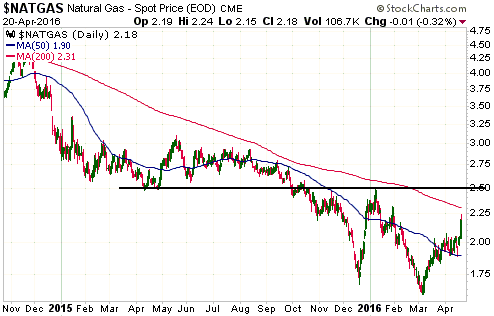
Natural Gas Explodes!
Natural Gas (NG) has been one of
the laggards in this year's commodity rally. Whereas the prices of most
industrial commodities bottomed during January-February, the NG price dropped to
a new bear-market low in early March. However, a price 'explosion' during the
first two days of this week suggests that its days of being a laggard are over.
There is substantial resistance at $2.30-$2.50 that will have to be overcome on
a weekly closing basis to signal a major trend reversal, but this week's price
action is probably an early warning that NG has joined an expanding list of
commodities that have turned the corner.
The Stock Market
The US
The rebound in the US stock market has gone beyond the limits of what we
originally thought was plausible. For example, the S&P500 Index (SPX) has
reached 2100, whereas shortly after the February low we mentioned 2075 as the
maximum level that the rebound in this index could reasonably be expected to
achieve. This means that the SPX has, to date, moved about 1% above the upper
limit we had in mind two months ago.
That the rebound has gone further than expected casts some doubt on our favoured
bear-market scenario, but we aren't ready to discard this scenario and the
small-scale bearish speculations (put options) that go with it. The current
situation actually feels like the first half of July last year, when, due to
similarities to previous market peaks, we chose to not only maintain a bearish
stance but also add to bearish speculations despite the extension of the rally
beyond what had previously been expected. That decision paid-off in a big way
over the ensuing 6 weeks. Our current decision to maintain/add-to bearish bets
won't necessarily pay off, but we think that the probabilities and potential
rewards are now similar.
The quickest and easiest way for us to illustrate the current potential is by
comparing the recent price action with the price action during the first half of
2001, using the NYSE Composite Index (NYA) as the market proxy.
Our point, in a nutshell, is that the rally from the February-2016 low could be
the equivalent of the rally from the March-2001 low. As indicated by the
following chart, after reaching a multi-month bottom in March-2001 the NYA
rebounded to its 200-day MA and then spent 2-3 weeks consolidating near this MA
before breaking out to the upside. The start of a decline to a new low for the
year got underway a few days after the aforementioned upside breakout and with
the daily RSI(14) at 71.
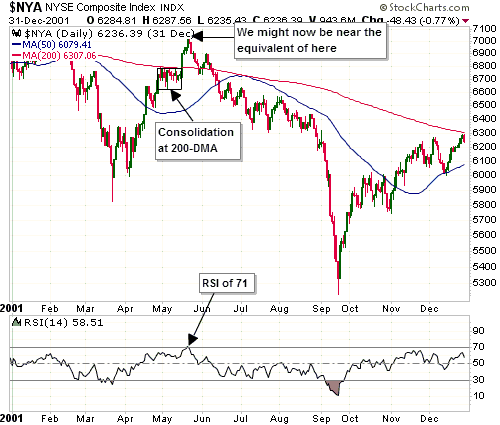
The next chart shows the current situation. The similarities between today and
the days near the May-2001 top are clear.
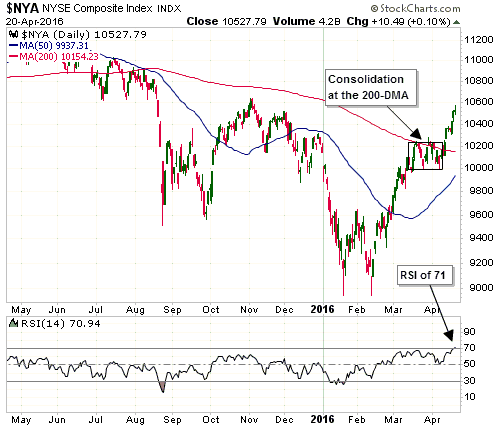
The upshot is that it makes sense to give our bearish scenario a little more
rope.
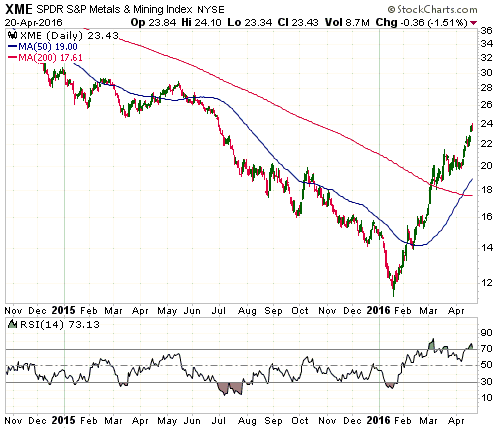
Non-gold mining stocks
Non-gold mining stocks, as represented on the following chart by the SPDR Metals
and Mining ETF (XME), have performed just as well as gold stocks since the
January bottom. In fact, a general increase in speculative enthusiasm for
mining-related equities had a lot to do with the ability of gold-mining stocks
to rally in parallel with a flat gold price over the past 2 months.
We last mentioned XME in mid-March, at which time it was trading near $20 and
was very stretched to the upside in momentum terms. It has since experienced
nothing more than a minor multi-day consolidation and has gained an additional
20%. Needless to say, it is still very stretched to the upside.
In mid-March we wrote:
"...XME put options now look interesting, either as a hedge for anyone with
long positions in commodity-related equities or as an outright bearish bet. We
bought a small position in XME June-2016 $16 put options for our own account
last Friday and will possibly add to the position if XME becomes even more
extended to the upside over the days/weeks ahead."
Despite XME becoming more extended to the upside we haven't yet bought any more
XME put options. This is because we have been presented with so many selling
opportunities over the past month that we are now about 50% cash across our
equity accounts. This is a higher cash percentage than we really want and means
that we feel no need to buy additional put options for hedging purposes.
Depending on price action we might buy some more XME puts before the end of this
week for speculative purposes, but if we do we will not choose the ones
previously mentioned. The June $16 puts are now too far out of the money and too
close to expiry to be our preferred vehicle. Instead, we will choose put options
with a September expiry and an exercise price of at least $18.
The Saudi Threat
A few days ago the New York Times reported that a Saudi official had threatened
to sell $750B of US Treasuries and other assets if the US government passed a
bill that would allow the families of 9/11 victims to sue the Saudi government
for its possible involvement in the terrorist strike. The sales would be made
due to the likelihood that Saudi assets in the US would be frozen if the bill is
passed and a lawsuit is initiated.
The Saudi government is probably the world's largest and most dangerous state
sponsor of terrorism, so we wouldn't be shocked to learn that it was somehow
involved in the 9/11 attacks. The Bill is unlikely to become law, though,
because if it is passed by parliament it will be vetoed by the President.
In the unlikely event that the Bill does become law and the families of 9/11
victims are able to sue the Saudi government, it will be a huge story and will
potentially result in covered-up information becoming public. However, any
selling by the Saudi government of US$-denominated assets would probably not
have a significant effect on the US financial markets.
Rising fear of inflation is by far the biggest threat to the T-Bond market. If
inflation expectations remain near current low levels or become even lower then
there will be more than enough demand for Treasury debt to absorb any selling by
the Saudis at current or higher prices, but if inflation expectations begin to
trend upward then the T-Bond will fall in price (rise in yield) regardless of
what the Saudis do.
Gold and the Dollar
Gold
More thoughts on the "gold fix"
The Shanghai Gold Exchange (SGE) has just implemented a twice-daily gold "fix".
The fixing in China will involve a total of 18 banks (16 Chinese banks and 2
international banks) and will happen along similar lines to the traditional
London fix. It will therefore be subject to the same conflicts of interest and
opportunities for very brief price manipulation that have cast aspersions on the
London gold fix. The question we pose is: why does there have to be a fix at
all?
The purpose of the fix is to create a benchmark that can be used in contracts,
but surely such a benchmark could be created using market prices without any
involvement from banks. For example, the London AM fix could be a
volume-weighted average of prices during the morning trading session in London
and the London PM fix could be the same for the afternoon trading session. The
Shanghai (Yuan) fix could be determined in the same way based on trading on the
SGE during specific time periods each day.
Current Market Situation
Having broken out of a narrow downward-sloping channel during the week before
last, the US$ gold price now appears to be chopping back and forth within a
similarly-narrow upward-sloping channel. Currently, the top of the new channel
is around $1280 and the bottom of the new channel is around $1235.
These multi-week price channels are within the context of a trendless market, in
that the price has now moved sideways for almost 2.5 months (the 20th April
close was within $2 of the 11th February close).
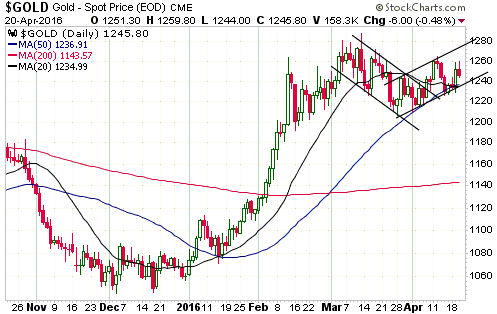
The high level of the speculative net-long position in COMEX gold futures
creates short-term downside risk, but won't, in and of itself, bring about a
significant price decline. Also, we reiterate that when it comes to speculative
positioning there are no absolute benchmarks. A consequence is that regardless
of how aggressively speculators, as a group, are betting on a price rise, it
will always be possible for them to become even more aggressive prior to an
important price top.
With the price action during the first three days of this week having extended
the overall sideways drift of the past 2+ months, the following excerpt from the
latest Weekly Update remains applicable:
"One possibility is that there will be a further surge in the level of
speculation over the next 2-3 weeks, propelling gold to the low-$1300s and
creating a blow-off move to the upside in the gold-mining sector. This is why
it's important to maintain a sizable core position in gold stocks. Another
possibility is that there will soon be a solid break below the 50-day MA in the
gold market, prompting the quick-fire liquidation of recently-taken speculative
positions in both gold and the mining stocks. This is why it's important NOT to
have leveraged positions predicated on a bullish near-term outcome."
Gold Stocks
The HUI remains very stretched to the upside and is again testing important
resistance defined by the January-2015 high. But as we've said countless times
over the past two months, there is no evidence that a short-term top has been
reached.
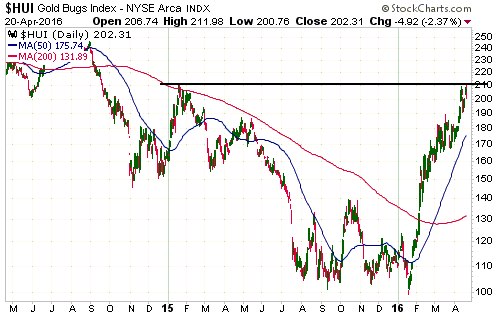
250 remains our 2016 target for the HUI. Based on the recent price action this
target is likely to be reached by mid-year, making the second half of the year a
time for 'corrective' price activity and the gradual accumulation of positions
in preparation for the even larger rally that will probably happen in 2017.
As mentioned in the latest Weekly Update, in order for the rally to continue for
another 2-3 months there will soon have to be a significant multi-week
correction (the HUI can't keep going up in a straight line). An alternative is
that we get an upside blow-off that takes the HUI to an intermediate-term peak
-- and the likely top for the year -- within the next 2-3 weeks.
The Currency Market
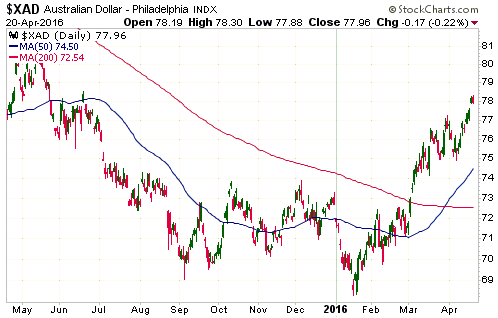
Last week we wrote:
"The A$ has essentially traded sideways over the past 4 weeks and is now
slightly below the top of its 4-week range. This period of range-trading could
be a consolidation, in which case there will probably be a final 1-3 week surge
prior to a short-term top. However, the 'ranging' activity of the past few weeks
could also be a topping pattern."
We now know that the range-trading was a consolidation, in which case the A$ is
probably immersed in a final 1-3 week surge prior to a short-term top. The same
can be said about the C$ and some high-profile commodities, most notably oil and
silver.
Updates on Stock Selections
Notes: 1) To review the complete list of current TSI stock selections, logon at
http://www.speculative-investor.com/new/market_logon.asp
and then click on "Stock Selections" in the menu. When at the Stock
Selections page, click on a stock's symbol to bring-up an archive of
our comments on the stock in question. 2) The Small Stock Watch List is
located at http://www.speculative-investor.com/new/smallstockwatch.html
Chart Sources
Charts appearing in today's commentary
are courtesy of:
http://stockcharts.com/index.html
![]()