![]()
![]()
![]()
![]()
- Interim Update 20th May 2020
Copyright
Reminder
The commentaries that appear at TSI
may not be distributed, in full or in part, without our written permission.
In particular, please note that the posting of extracts from TSI commentaries
at other web sites or providing links to TSI commentaries at other web
sites (for example, at discussion boards) without our written permission
is prohibited.
We reserve the right to immediately
terminate the subscription of any TSI subscriber who distributes the TSI
commentaries without our written permission.
There will be a 'V'
recovery...sort of
The rebound from the H1-2020
plunge into recession probably will look like a 'V', at least initially.
This is not because conditions will become positive as quickly as they
became negative, but because conditions got so bad so quickly that charts
of economic statistics such as industrial production and retail sales will
appear to make a 'V' bottom in Q2-Q3 of this year. However, the 'V' won't
mark the start of a genuine recovery.
The following charts show
what we mean by "got so bad so quickly".
The first chart shows that
within the space of three months the Small Business Optimism Index
collapsed from a level that indicated a high level of optimism to one of
the lowest levels in the 34-year history of the index. The only other
decline of this magnitude occurred during the 2005-2008 period and took
more than two years.
The second chart shows that Industrial
Production has just registered its largest month-over-month decline in at
least 101 years. By this measure, even the worst months of the Great
Depression were not as bad as April-2020.
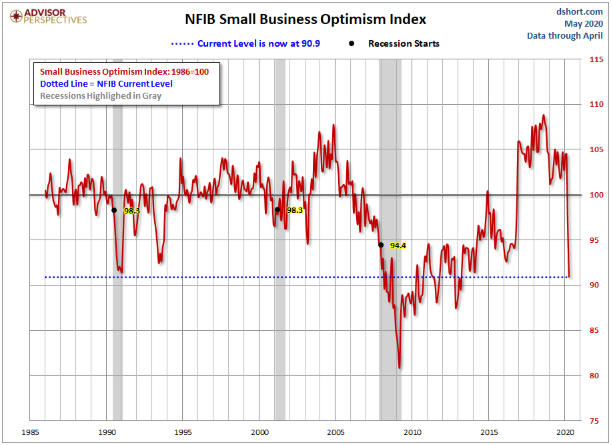
Source:
dshort
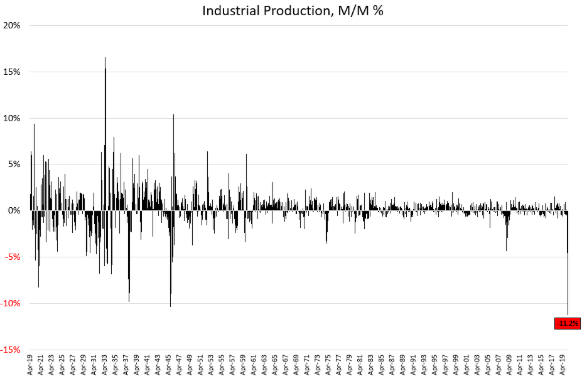
Source:
Hedgeye
There are thousands of people who have lost their
businesses -- in some cases, businesses that they spent the bulk of their
adult lives building -- over the past two months as a result of the
lockdowns. These people probably are feeling angry and/or devastated.
However, we get the impression that the vast majority of people have
accepted the lockdowns with equanimity. They haven't taken to the streets
to protest the economic destruction that has been wrought by their
political overlords. Instead, they have shrugged off the most rapid
decline in industrial production in history and a sudden rise in the
unemployment rate from below 4% to above 20%. How is this possible?
It's possible only because the government and the Fed have showered
the people with money. The money that has been created out of nothing is
acting like pain-suppressing medication. In effect, the government and the
Fed have administered anaesthetic so that the patient felt no pain as
vital organs were removed. Without this anaesthetic, the populace would
not have remained docile as its basic rights were cancelled and its
economic prospects were greatly diminished.
Money, however, is
just the medium of exchange. It facilitates the division of labour*, but
it does not constitute real wealth. For example, if every current dollar
were instantly replaced by ten dollars, there wouldn't be any additional
wealth. The point is that the government and the Fed cannot make up for
the decline in real wealth caused by the lockdowns by providing more
money. All they can do is change the prices of the wealth that remains.
There will be a 'V' shaped recovery, but due to the destruction of
real wealth stemming from the lockdowns the rising part of the V is bound
to be much shorter than the declining part of the V. This will lead to a
general realisation that life for the majority of people will be far more
difficult in the future than it was over the preceding few years.
Returning to our medical analogy, eventually the anaesthetic will wear off
and the patient will have to start dealing with the consequences of having
lost a kidney, a spleen, a lung and half a liver.
*In the absence of money, a tomato farmer who needed some dental work
would have to locate a dentist who needed a few crates of tomatoes.
The June oil
contract expires without incident
At around this time last month
the May-2020 oil futures contract expired with a bang. On expiry day the
price plunged by an incredible 350% to NEGATIVE $38/barrel. It was
probably the most dramatic day in the history of oil trading. It was
caused by some traders getting themselves into the position where they
could be forced to take delivery of physical oil at a time when oil
storage space was in such short supply that its price had gone through the
roof.
It was feared that something similar would happen leading up
to the expiry of the June-2020 oil futures contract, but the following
daily chart shows that this fear proved to be unfounded. The June-2020 oil
futures contract expired with a whimper on Tuesday of this week.
There is no doubt that it is much easier and less costly to store oil now
than it was a month ago. Also, it is clear that anyone trading June-2020
oil from the long side and who didn't have ready access to oil storage
learned from what happened in April and exited before the delivery period.
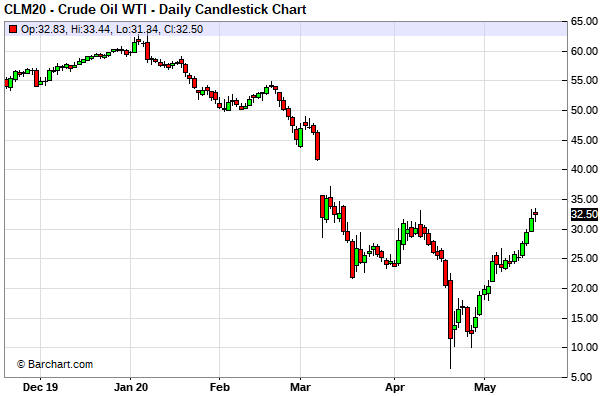
Due to the tightening supply situation the December-2020 oil futures
contract could trade as high as $40 prior to the start of the next
meaningful decline, but the short-term risk/reward is neutral due to the
risk that demand will not rebound as quickly over the next few months as
many speculators seem to be expecting. Adding to the risk side of the
equation is that there has been another regional virus-related lockdown in
China.
*This is the top of the short-term
target range we mentioned in earlier commentaries. At the moment this
contract is trading near $35, which is the bottom of our short-term target
range.
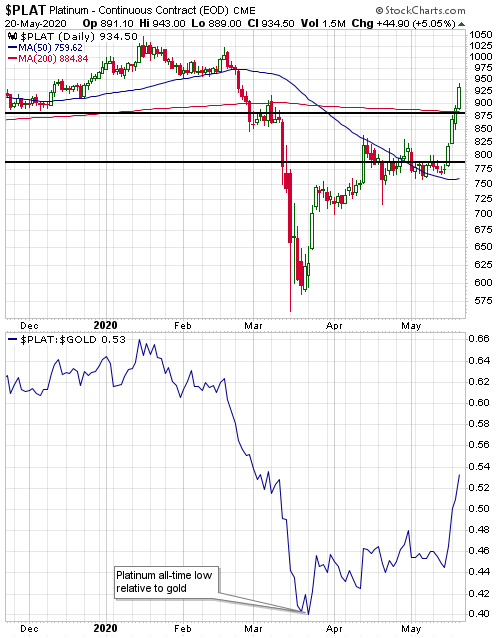
Platinum blasts through
resistance
The platinum price crashed in
March and briefly traded below $600/oz. We wrote at the time that this
constituted a big over-reaction, because the price was more than fully
discounting a large decline in demand for the metal but failing to account
for a large decline in the supply of the metal.
Fast forwarding to
the current situation, in the latest Weekly Update we noted that the
platinum price remained within the trading pattern of the preceding month,
but that Friday's price action suggested that an upside breakout followed
by a quick move to resistance in the high-$800s was coming. As it turned
out, the market performed even better than anticipated and the price broke
through resistance like a sharp knife through warm butter.
The
platinum market is now almost 180 degrees from where it was in mid-March
and is in a similar short-term position to the stock market, in that it
appears to be reflecting too much economic-recovery optimism.
The Stock Market
Soon after the stock market
bottomed in March we mentioned that 2800-2900 was a reasonable target for
the rebound that was just getting underway. The top of this target range
was reached in mid-April.
We subsequently mentioned that the SPX's
rebound could extend as far as the 200-day MA near 3000, which it almost
has done. However, our opinion over the past few weeks has been that while
some additional upward progress was possible, the short-term risk/reward
had become decidedly skewed towards risk.
One plausible scenario
involved the SPX trading sideways within a roughly 10% range over the
ensuing few months as short-term economic/medical pluses (optimism
associated with the return to work and COVID-19 medication progress) were
counteracted by the realisation that long-term economic damage has been
done, but at the same time there was a realistic chance that the SPX would
drop back to test its March low. In other words, a small amount of
additional reward potential versus substantial risk.
A portion of
the small additional reward potential was used up during the first three
trading days of this week, while the warnings about short-term downside
risk became louder.
The most important new signs of increasing risk
are:
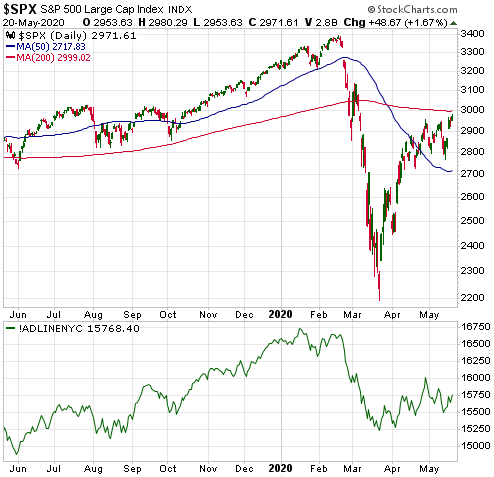
1) The new multi-month high achieved by the SPX on Wednesday
20th May was accompanied by a lower high in the NYSE Advance-Decline Line
(ADL). Refer to the following daily chart for the details. This is a
bearish divergence/non-confirmation.
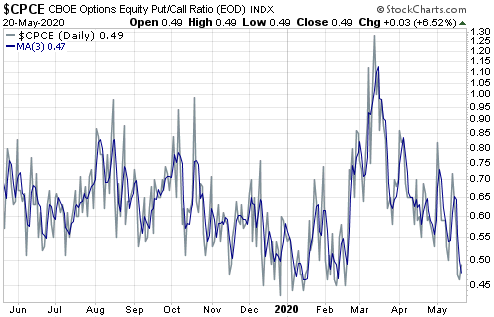
The 3-day MA of the equity put/call ratio (the blue line on the
following chart) has dropped to only 0.47, which reflects considerable
bullishness on the part of the 'dumb money'. This sentiment indicator has
almost returned to its January-February extreme, despite the intervening
economic disaster.
The above bearish signs don't predict an immediate top, they just
suggest that technical- and sentiment-related negatives have been added to
the fundamental negatives. Therefore, don't be lulled by this week's new
rebound high for the SPX into thinking that the market is now less risky.
It is more risky.
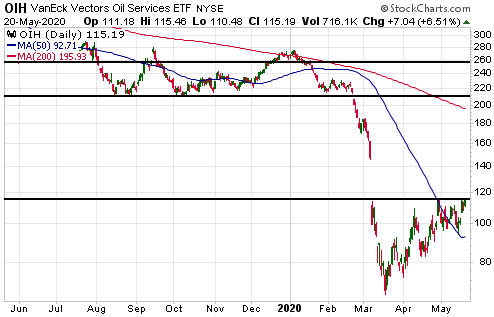
This is a time to be looking for selling
opportunities and/or tightening stops and/or hedging in some way. Unlike
the senior US stock indices, some commodity-related stocks and ETFs still
have significant short-term upside potential. For example, the Oil
Services ETF (OIH) could be about to complete a basing pattern (see chart
below). However, the entire market looks vulnerable.
We think the
best-case scenario involves a multi-month period of range trading by the
SPX. This scenario is plausible and potentially would allow the relatively
cheap commodity-related stocks/ETFs to make catch-up moves, but, as
mentioned earlier, a return to the March low is also plausible.
Gold and the Dollar
Gold
The
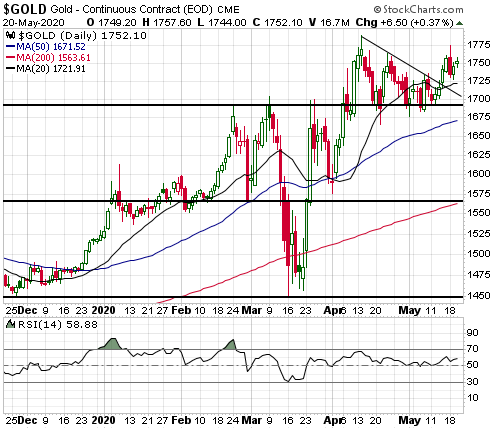
US$ gold price tested its April high on Monday of this week and then
reversed. Monday was an outside down day, but it didn't negate last week's
upside breakout. It would take a daily close below $1716 to do that and a
daily close below $1680, or a weekly close below $1690, to signal a
short-term trend change from up to down.
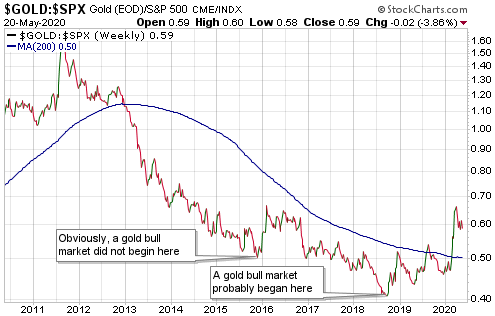
The surge in the gold/SPX ratio from below to well above its 200-week
MA (the blue line on the following chart) in March of this year confirmed
that a gold bull market began in Q3 of 2018. However, until gold/SPX
exceeds its March high there will be a risk that the March-2020 stock
market crash caused the gold/SPX ratio to generate a false signal. Our
concern is that the only other false signal by the gold/SPX ratio over the
past four decades resulted from the October-1987 stock market crash.
Gold Stocks
The HUI broke above long-term
resistance at 286 last Friday and consolidated above resistance during the
first three days of this week.
A daily close below 280 would warn
that last week's breakout was a false signal. Putting it another way, at
this stage it would be reasonable for traders to assume that last week's
breakout was the genuine article as long as the HUI holds above 280 on a
daily closing basis.
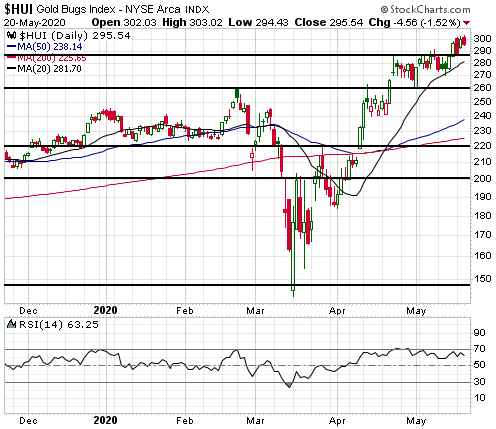
Despite last Friday's upside breakout by the HUI, with regard to our
gold stock portfolio we are looking for opportunities to take some money
off the table. Our preference is to scale out of positions into strength
rather than attempt to catch the top or sell after the price has confirmed
a downward trend reversal, especially when dealing with the junior gold
stocks. The scaling process obviates the need to get the timing exactly
right and leaves us with 'core' exposure in case the market runs away to
the upside.
We probably won't buy new insurance in the form of GDX
put options until there is preliminary evidence of a top. At the moment, a
daily HUI close below 280 would be the preliminary evidence.
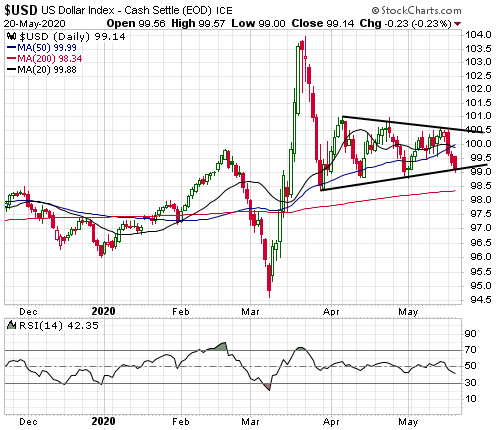
The Currency Market
Over the first three days of
this week the Dollar Index (DX) moved from the top to the bottom of its
short-term contracting range. It will have to close below 98.7 or above
100.6 to break out of this pattern.
The pattern suggests that
there will be at least a 2-point move in the direction of the breakout,
which is not something that we will be interested in trading.
We
continue to expect that the next tradable (substantial, multi-month) move
in the DX will be to the downside.
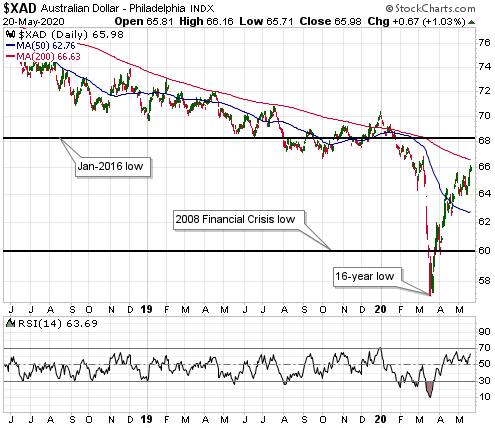
Over the past three months the Australian dollar (A$) traded in synch
with the SPX. Like the SPX it crashed during the final week of February
and the first half of March, rebounded to the 50-day MA by mid-April,
consolidated for a while and then extended its rebound to slightly below
the 200-day MA this week. The correlation suggests that the A$ is
vulnerable to stock market weakness.
We remain bullish with regard
to the A$'s intermediate-term prospects. This is mainly because the
currency should benefit from the higher commodity prices that will
materialise over the coming 2 years thanks to the combination of
profligate money creation and reduced commodity supply outside Australia.
In the short-term we are concerned about the potential effects on
A$ demand of a sizable stock market decline.
Updates on Stock Selections
Notes: 1) To review the complete list of current TSI stock selections, logon at
http://www.speculative-investor.com/new/market_logon.asp
and then click on "Stock Selections" in the menu. When at the Stock
Selections page, click on a stock's symbol to bring-up an archive of
our comments on the stock in question. 2) The Small Stock Watch List is
located at http://www.speculative-investor.com/new/smallstockwatch.html
![]() The
Tanker Trade
The
Tanker Trade
On 8th May Euronav (EURN), the owner of a
fleet of oil tankers that had just reported a huge increase in quarterly
earnings and dividend, was added to the TSI List as a trade with an
expected duration of 3-9 months. Our aim at that time was to add a second
tanker stock (probably Frontline (NYSE: FRO)) to the TSI List within the
ensuing few weeks.
Frontline (FRO)
reported its Q1 results on Wednesday
20th May. As was the case with EURN, FRO announced a huge increase in
earnings and dividend.
FRO reported quarterly earnings of
US$0.84/share and declared a quarterly cash dividend of US$0.70/share.
This means that FRO shares are being priced at less than 10-times a single
quarter's earnings and that the stock is yielding almost 10% based on a
single quarter's dividend.
As was also the case with EURN, the
stock market's reaction to FRO's spectacular earnings was minimal.
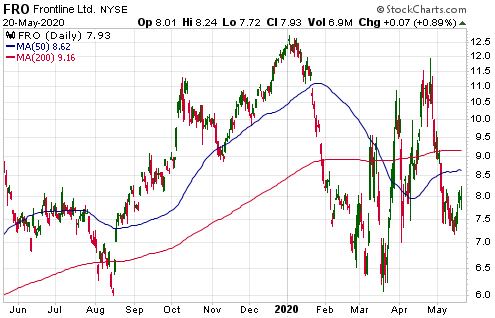
The stock market clearly expects that day rates for tankers will
plunge during the second half of this year, which is certainly possible
due to the intersection of supply cuts and a modest increase in demand. In
fact, there are signs that tanker rates have peaked. For example, FRO's
20th May press release contained this quote from its CEO: "The tanker
market has corrected downwards in recent weeks and faces pressure in the
short term, both from production cuts and inventory draws...".
However, we continue to like the tanker trade because a pessimistic
forecast for tanker day rates appears to be fully discounted by current
share prices. This suggests that the risk is low and that future surprises
are more likely to be positive than negative.
We may add FRO to
the TSI List in the future as part of our tanker trade, but at this stage
we will stick with EURN. If we do add FRO it probably will be prior to 3rd
June, which is when the stock goes ex-dividend.
 Battening down the hatches
In the 23rd March
Weekly Update we explained why we would start applying trailing stop
losses (TSLs) to the stocks and ETFs that go into the "Trading Positions &
ETFs" section of the TSI Stocks List. Here's part of what we wrote at that
time:
"We generally don't use protective stops in our own
trading/investing (we use other methods to manage risk, including the ones
mentioned above as well as buying insurance in the form of put options
from time to time). Also, we generally don't apply any risk management
techniques to the TSI Stocks List, primarily because it's a list of
speculating/investing ideas and not a recommended portfolio. We have
decided that from now on, however, unless stated otherwise we will apply a
20% trailing stop (based on daily closing prices) to stocks and ETFs that
go into the "Trading Positions & ETFs" section of the Stocks List. This
will force us to focus on securities that offer reasonable liquidity and
to be more disciplined.
The 20% trailing stop will be applied to
all future inclusions in the "Trading Positions & ETFs" section of the
Stocks List, but at the moment it only applies to the PPLT (Physical
Platinum ETF) position added last week and the U.TO (Physical Uranium
Fund) position added via today's report."
Due to the
increasing short-term risk for the overall market as well as the potential
for additional short-term gains in some commodity-related stocks/ETFs, we
now will apply TSLs to other TSI trading positions. In each case, the
initial stop will be based on the highest closing price of the past two
months. The stop subsequently will be adjusted upward if this price is
exceeded.
The details are shown in the following table.
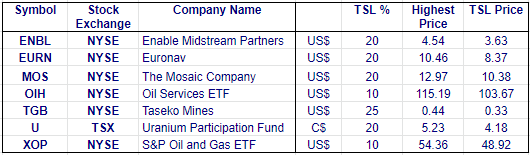
Chart Sources
Charts appearing in today's commentary
are courtesy of:
https://stockcharts.com/
https://www.barchart.com/
![]()