|
- Interim Update 20th July 2005
Copyright
Reminder
The commentaries that appear at TSI
may not be distributed, in full or in part, without our written permission.
In particular, please note that the posting of extracts from TSI commentaries
at other web sites or providing links to TSI commentaries at other web
sites (for example, at discussion boards) without our written permission
is prohibited.
We reserve the right to immediately
terminate the subscription of any TSI subscriber who distributes the TSI
commentaries without our written permission.
Interesting Articles
We occasionally refer to Paul
van Eeden's analysis of the long-term relationship between changes in
the gold price and changes in the total supply of US dollars. A good
article by Mr van Eeden dealing with this topic can be found at http://www.kitco.com/weekly/paulvaneeden/jul152005.html.
In this article he notes that the current "fair value" of gold, based
on changes in the total quantities of gold and US dollars over the past
60 years or so, is around US$770.
In addition to moving in response to US$ inflation over the very
long-term (generations), it's important to understand that over shorter
time periods -- periods of up to 20 years -- the gold price is
influenced to a greater extent by inflation expectations than by actual
monetary inflation. This is why gold makes huge moves above and below
its so-called fair value and why it would be a bad idea to buy gold
simply because it was below its fair value or to sell gold simply
because it was above its fair value. For example, based solely on the
total supply of US dollars gold was fully valued at $200 in mid 1978,
but this didn't prevent the gold price from rising to $850 by January
of 1980 in parallel with burgeoning fears that the inflation was going
to get much worse. In other words, over a normal investment timeframe
(1-5 years) an investor in gold must have good reason to believe that
inflation expectations are going to rise.
Our view is that the actual rate of inflation (money supply growth)
reached its high for the decade during the final quarter of 2001, but
that fear of currency debasement will drive the gold price to a
multiple of its "fair value" within the next 5 years.
We'd also like to draw your attention to a recent article by Antal Fekete posted at http://www.gold-eagle.com/gold_digest_05/fekete071205.html.
This article primarily deals with the importance of incorporating a
clearing system for "real bills" into any proposal for a return to
gold-based money, but also covers other ideas relating to trade,
banking, monetary history and the gold standard. It is much longer and
more difficult to read/understand than the aforementioned van Eeden
piece, but it's well worth the effort.
Bonds
...if
an intermediate-term peak was put in place in the oil market earlier
this month then a continuation of the bond-oil relationship would
result in an October peak for bonds. ...if bonds move to new highs for
the year by October and the Fed hikes the official short-term rate by
25 basis points at each of its next two meetings then the US will
almost certainly end up with an inverted yield curve.
Bonds and Oil
In previous commentaries -- most recently in the 29th June Interim
Update -- we discussed the somewhat strange lead-lag relationship
between oil and US T-Bonds. The fundamental reason for this
relationship escapes us, but it's a fact that over the past 4 years or
so turning points in the oil market have consistently led turning
points in the bond market by 3-4 months. The oil market failed to
predict the sharp decline in the bond market that occurred during the
second quarter of 2004, but it has predicted every other important
turning point. Furthermore, every important trend reversal in the oil
market over the past four years has been followed, 3-4 months later, by
a similar trend reversal in the bond market.
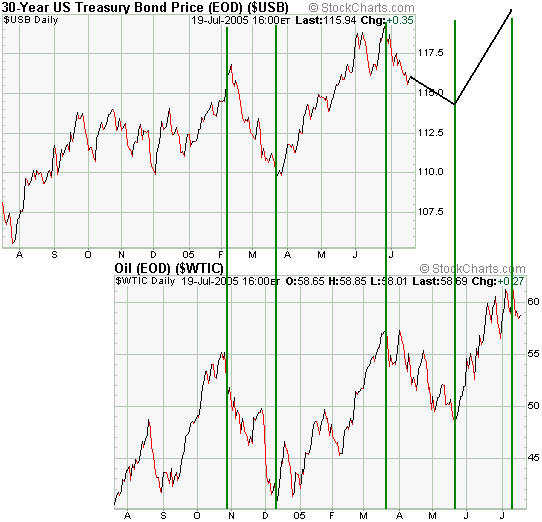
The following chart shows the current bonds-versus-oil situation,
including a projection of what the T-Bond price will do over the next
few months if the relationship continues to work. If the relationship
holds then the pullback in the bond market that began in late June will
bottom within the next 5 weeks and will be followed by another strong
rally. Furthermore, if an intermediate-term peak was put in place in
the oil market earlier this month then a continuation of the bond-oil
relationship would result in an October peak for bonds.
It would be an understatement to say that bonds were stronger during
April-June than we had expected them to be. This creates a quandary for
us because there's now even less value in bonds than there was at the
beginning of the year, but we are now entering a 3-6 month period when
the backdrop will likely become increasingly bond-friendly due to
falling commodity prices. Also, Greenspan and Co. will probably
continue to push short-term interest rates higher until there's
substantial weakness in the stock and/or commodity markets, and in
doing so they should ensure that inflation expectations remain low (the
market won't worry about inflation as long as the Fed is perceived to
be on the case). In other words, there isn't likely to be a major
downturn in bonds until the Fed begins to overtly promote inflation;
and that's probably not going to happen until after the stock and
commodity markets tank.
Putting it all together
We've been intermediate-term bearish on bonds since 20 September of
last year. There's been a lot of back-and-forth movement since then,
but the net result has been little change (T-Bonds are now about 3
points higher than they were then and T-Notes about 1.5 points lower).
It's just been a very frustrating market with price-insensitive buyers
such as the Asian central banks doing enough to offset the downward
pressure exerted by speculative short-selling.
Given that it now looks like bonds could remain firm until at least
October it doesn't make sense for us to retain an intermediate-term
bearish view on this market. However, the upside potential looks quite
limited and there is a risk that the commodity and stock markets do not
follow our script (if the stock and commodity markets move higher over
the coming months then bond prices would probably tumble). The result
is that an intermediate-term bullish view also appears to be
inappropriate. We are therefore going to switch to an intermediate-term
"neutral" position on the bond market whilst retaining a short-term
bearish view in anticipation of some additional downside over the next
few weeks.
On a side note, if bonds move to new highs for the year by October and
the Fed hikes the official short-term rate by 25 basis points at each
of its next two meetings then the US will almost certainly end up with
an inverted yield curve. Some pundits, including the Fed Chairman, have
already started making the case that a yield curve inversion within the
next few months would not have the same implication it has had in the
past (an inverted yield curve has, in the past, invariably been
followed by a recession). Our view, however, is that a yield-curve
inversion later this year coupled with the downturn in the rate of
money-supply growth that has already occurred would make a recession a
high probability outcome for 2006.
The US
Stock Market
Current Market Situation
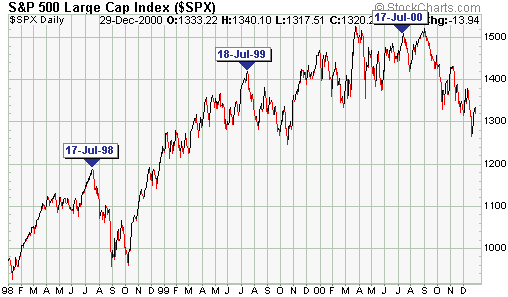
There is a tendency for turning points in the US stock market to occur
between the 17th and 24th of July. The below chart, for instance,
highlights the intermediate-term peaks that occurred in mid July of
1998, 1999 and 2000. Also, the S&P500's closing low of the
2000-2002 bear market occurred on 23rd July 2002.
With the S&P500
Index having just rallied strongly into mid July of this year and with
sentiment indicators signaling that the market is presently
'overbought' there exists the POTENTIAL for another important mid-July
turning point. In order for this potential to be realised, however,
there will have to be a trend reversal -- from up to down -- between
now and next Monday.
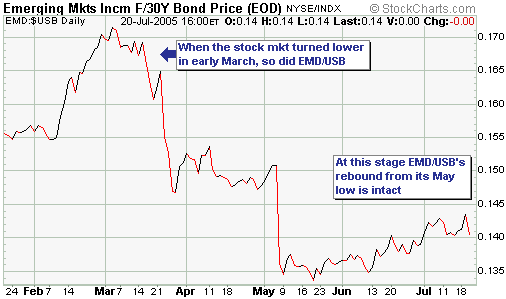
We haven't yet begun to see any meaningful signs of weakness in the
market. For example, the below chart shows that the government debt
issued by emerging market countries is still in a short-term upward
trend relative to US Government debt, indicating that investors are
continuing to become less risk averse. The NDX/Dow and SOX/NDX ratios
are giving similar messages. Therefore, if the market does turn lower
over the next few days the outcome would probably end up being more
akin to what happened following the mid-July peak of 2000 than what
happened following the mid-July peaks of 1998 or 1999. In 2000, the
market dropped sharply during the second half of July and then
rebounded to a marginal new high before a large decline got underway.
The Real S&P500
The below chart adds weight to the idea that a turning point might be
close at hand. It shows that, in terms of gold, the S&P500 Index is
currently at the very top of its 2-year range. Assuming we are NOT
going to get an upside breakout in the S&P500/gold ratio, this
means that the S&P500 will only be able to move higher if the gold
price moves higher. If the gold price were to rebound to $430, for
instance, then the S&P500 Index could move up to 1260 without
causing the S&P500/gold ratio to move out of its 2-year range.

The stock market versus Greenspan
The US stock market is currently involved in a game of 'chicken' with
Fed Chief Greenspan in that the market is saying "we are going to keep
rallying because we know you will soon stop hiking the Fed Funds rate"
at the same time as Greenspan is saying "we are going to keep hiking
the Fed Funds rate until we see evidence that the rate hikes are taking
an appropriate toll". Greenspan appears to be more interested in
quelling speculation in real estate than in halting the stock market's
advance, but the property market is unlikely to buckle until after the
stock market gets hit.
Our money is on Greenspan to win this game.
Gold and
the Dollar
Gold Stocks
We suspect that the May-July rebound in the gold sector has ended and
that the next downward leg in the cyclical bear market that began in
December of 2003 is underway. However, at this stage there isn't much
in the way of evidence to either support or deny this view.
The clearest sign that a top is in place would be a move by the
HUI/gold ratio to below its 40-day moving average. The following chart
shows that this moving average is now quite near the current price so
it wouldn't take much weakness in the major gold stocks relative to the
metal to generate a bearish signal.
The only breakdown of
note in the gold sector over the past few weeks has been NEM's drop
below the support (now resistance) that exists at around 38.60.
Further to the above,
the short-term outlook for the gold sector will become more positive if
NEM is able to close above $39 during the coming days/weeks and
HUI/gold remains above its 40-day moving average.
Current Market Situation
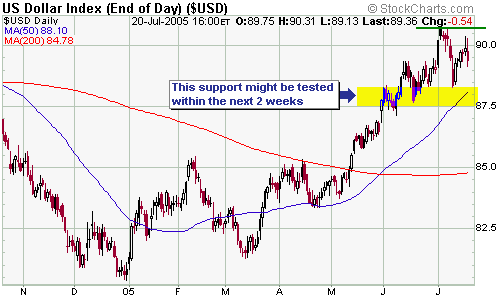
The US$ is immersed in its biggest correction since March. The
correction is probably not yet over and could result in a test of
support at 87.5-88.0 within the next couple of weeks.
The current correction will likely be followed by a rally to a new high
for the year and we remain short-term bullish on the dollar in
anticipation of such an outcome. However, as mentioned in a recent
commentary the FIRST phase of the dollar's recovery from its
December-2004 bottom is probably more than 80% complete.
If the dollar's
correction does continue for another 1-2 weeks then gold will likely
move a bit higher before it resumes its decline. We doubt that gold
will trade in the 440s again in the near future, but a move up to
around $430 would not surprise us.
The A$ and Gold
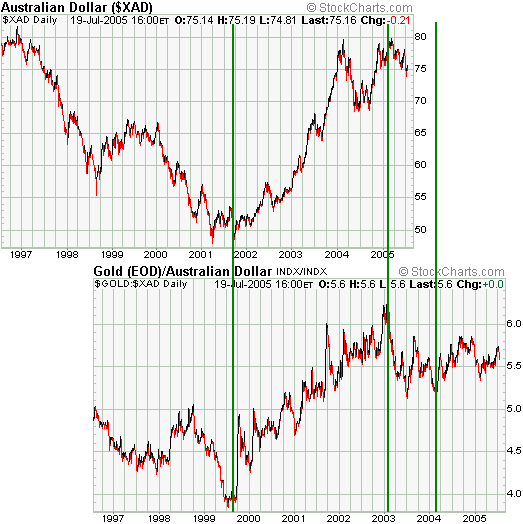
The following charts of the Australian Dollar (AUD/USD) and the
Australian Dollar gold price have been offset by two years to reflect
the idea that gold/A$ leads A$/US$ by that amount of time. These types
of chart comparisons should never be taken too literally because major
turning points can never be predicted months or years in advance, but
they can be useful in molding our general expectations for the markets.
This particular chart comparison, for example, suggests that IF a new
multi-year advance in gold/A$ began during the first half of 2004 (we
think it did) then a new multi-year advance in the A$ should begin
during the first half of 2006. We are comfortable with this chart
comparison because it meshes with much of our other work and because it
is based on the very reasonable theory that gold rises in terms of the
less-senior currencies before it rises in terms of the senior currency
(the US$)*.
The A$ is a commodity
currency and over the long-term it tends to reverse direction at the
same time as, or in front of, similar reversals in the CRB Index.
Therefore, an implication of the above chart is that the next
multi-year advance in the CRB Index is unlikely to begin until at least
the second quarter of next year.
*The consensus
view amongst gold market analysts seems to be that gold experienced a
sizeable rally in US$ terms over the past few years and that the next
stage of the gold bull market will see it rising in terms of all
currencies. However, a review of long-term charts will tell anyone with
eyes that gold began to trend higher against the euro, the Swiss Franc,
the Yen, the Australian Dollar and the Canadian Dollar well before it
began to trend higher against the US$.
Update
on Stock Selections
 We
are going to add a second position in the DJX Dec-06 $104 put options
(YDKXZ) to the TSI Stocks List at yesterday's closing price of US$4.80.
Showing two positions in the TSI List in this one option contract will
allow us to exit in stages, which is what we prefer to do with our own
trading/investing. We
are going to add a second position in the DJX Dec-06 $104 put options
(YDKXZ) to the TSI Stocks List at yesterday's closing price of US$4.80.
Showing two positions in the TSI List in this one option contract will
allow us to exit in stages, which is what we prefer to do with our own
trading/investing.
 Broadwing (NASDAQ: BWNG) announced early this week that the August
payment on its convertible debt would be made in cash rather than
shares. Stock dilution due to paying-off debt using under-valued shares
has previously put a lot of downward pressure on the stock price, so
this week's announcement was very good news.
At yesterday's closing price of US$4.99 BWNG was being valued by the
stock market at only 34% of its annual revenue, which is extremely low
ASSUMING the company will be able to become cash-flow positive within
the next few quarters. The next opportunity to see how close BWNG is to
becoming profitable will be on 29th July when the next quarterly
financial results are announced.
We think BWNG is a speculative buy at the current price.
Chart Sources
Charts appearing in today's commentary
are courtesy of:
http://stockcharts.com/index.html

|

