|
- Interim Update 20th August 2003
The Derivative
Time Bomb and the Yen
The total notional value of all outstanding
derivative contracts is apparently around 150 trillion dollars, or many
times the world's GDP. This, in itself, is not a problem because the "notional
value" of a derivative is not a good measure of the risk being taken by
the parties to a derivative contract. To take a simple example, assume
that Trader Bob pays 15c per option for call options with an exercise price
of $50 covering 10,000 shares of International Paper. Bob would therefore
own options with a notional value of $500,000 (10,000 times $50), but his
maximum risk would only be $1,500 (the amount paid for the options). Obviously,
someone had to sell the options to Bob and the option-seller's downside
risk would be unlimited unless they had sold the options to hedge an existing
position in the stock, that is, unless the seller owned at least 10,000
shares of International Paper. If this was, in fact, the case, then the
seller would have no risk of loss and the maximum total potential loss
associated with the transaction would be Bob's $1,500, or only 0.3% of
the notional value of the associated derivatives.
If the average maximum downside risk
across all outstanding derivative contracts was equal to 0.3% of notional
value then the maximum potential loss associated with the above-mentioned
150 trillion dollars of derivatives would be only 450 billion dollars,
a far more manageable situation. Of course, the vast majority of derivative
transactions aren't simple call-option trades such as the one described
above, but our point is that a problem does not necessarily exist just
because the notional value of outstanding derivatives is an eye-popping
150 trillion dollars.
It is not possible to determine the
likely extent of any future derivative-related problems because the information
needed to make such a determination is not available. We think it is, however,
reasonable to assume that there will be major problems over the
next few years, not because the notional value of outstanding derivatives
is so large but because many of the major players in the financial markets
invariably fail to correctly anticipate important trend changes. As such,
many will be positioned as if the trends of the past few years were certain
to continue well into the future. So if, for example, we are correct in
our view that the major trend for long-term interest rates has reversed
from down to up then a significant chunk of the currently outstanding derivatives
are going to result in losses that are far greater than the parties to
these contracts would have originally considered possible.
A good example of what can happen when
something unexpected occurs in a market where there are a lot of outstanding
derivative contracts is provided by the behaviour of the Yen during 1994-1995.
During the second half of 1994 and the first 2 months of 1995 the Yen traded
in a very narrow range (see chart below) and many of the biggest participants
in the Yen-US$ market (financial market speculators and Japanese exporters)
were convinced that the Yen would remain range-bound for the foreseeable
future. Many derivative contracts were therefore entered into on this basis.
As such, when the Yen moved upwards out of its trading range at the beginning
of March 1995 a massive re-positioning was suddenly called for. First,
speculators who had written options on the basis that the Yen would not
move above 104 rushed to hedge their positions by buying Yen. Then, Japanese
exporters that had limited their US$ hedges on the basis that the Dollar
would not fall below a certain level were forced to sell the US$ against
the Yen. The end result was that the Yen rose by almost 20% against the
US$ in the space of only 6 weeks.
Interestingly, a similar situation
is most likely brewing right now in the currency market. The Bank of Japan
has let it be known that they will do whatever they have to do to prevent
the Yen from moving above the 86-87 area (see chart below), so it is reasonable
to assume that a large dollar-volume of derivative contracts have been
entered into on this basis. Therefore, when the Yen does eventually move
above the BOJ's 'line in the sand' we will probably see a quick-fire 10%-20%
rally.
To determine the most likely cause
of a future derivative-related panic in the financial markets just look
for the things that everyone knows to be true and consider the probability
that what everyone knows to be true will turn out to be false. As we look
around the financial world today there are two such things that stick out.
One, as mentioned above, is that the Yen will remain beneath the 86-87
level. The other, which is potentially more significant due to the much
larger sums of money involved in interest-rate derivatives than any other
types of derivatives, is that the Fed and other central banks will hold
short-term interest rates near their current low levels for a long time
to come.
The US
Stock Market
Value
A corporate insider will usually be
in a much better position to determine whether or not the current price
of his/her company's shares represents good value than will a typical non-insider.
As such, it is not surprising that stock market bears are presently making
a big deal out of the fact that the level of selling by corporate insiders
recently hit a 17-year high. However, while a high level of insider selling
relative to insider buying strongly suggests that the market as a whole
is over-valued it doesn't tell us anything about what the market is likely
to do over the next few months. For example, the last time the level of
insider selling was at current levels or higher was 1986, but following
the 1986 peak in insider selling the market rallied strongly for another
year. In order to figure out whether or not the market can continue to
advance in the face generally high valuations other indicators must be
considered. Before we do that, though, we'll take another look at the market's
current value (or lack thereof).
Is the market really over-priced at
its current level as the bears proclaim or are there other factors that,
when taken into account, transform a superficially over-valued market into
a reasonably priced one?
From a price relative to earnings perspective
the market is certainly very expensive. For example, the S&P500 Index
is presently trading at 36 times trailing 12-month "as reported" earnings
and 23 times expected 2003 "as reported" earnings ("as reported" earnings
are the earnings that companies report in their taxation returns). Because
this is well above the S&P500's long-term average P/E of 14.5 we could
conclude that the market is extremely expensive. However, we don't like
to use the market's P/E ratio in isolation because it might be that a major
downturn in profits has caused a surge in the P/E ratio and that the ratio
will plunge during the next recovery in profits. The message of the P/E
ratio can, though, be checked by looking at other measures of value such
as the price-to-sales ratio. If P/E ratios were painting a false picture
of market value then the price/sales ratio should be low. However, the
current price-to-sales ratio of the S&P500 Index is around 1.5 (source:
www.barra.com), or at least 50% higher than where it would be if the market's
P/E ratio was being artificially inflated by a major downturn in profits
rather than by the unrealistic expectations of investors.
In fact, with one exception it really
doesn't matter which ratios we use to measure value, the answer is always
the same: The market will need to fall by 30%-50% from its current level
in order to restore some semblance of value. The one exception is the so-called
"Fed model" which determines value by comparing the earnings yield on the
S&P500 Index with the yield on 10-year Government bonds. We won't discuss
the Fed model at this time except to state that it doesn't stand up to
serious scrutiny (it works reasonably well if only the data from the past
25 years are considered but doesn't work well over much longer time periods).
In any case, if we are right about bonds then any justification of current
stock-market values which is based on the Fed model is going to fall flat
on its face because long-term interest rates are headed MUCH higher over
the coming 12 months.
Sentiment
The OEX Volatility Index (VIX) hit
a new 52-week low this week, indicating a total lack of fear on the part
of options traders. As the following chart comparison of the S&P500
Index and the VIX shows, on those occasions over the past six years when
the VIX has moved down to near its current level the market has been unable
to make any significant upside progress. In fact, on most occasions when
the VIX has moved under 20 a sharp decline in the S&P500 Index has
soon followed.
Could it be different this time? Could
the VIX actually be on its way to a much lower level while the market moves
considerably higher? Of course this is possible and it is the existence
of such a possibility that allows the VIX to get so low in the first place.
After all, everyone knows that a drop in the VIX to under 20 has invariably
been followed by a sharp decline over the past several years, yet the fact
that it is down here again is evidence that the majority of market participants
expect that something different is going to happen this time around. In
other words, if a lot of people were genuinely worried about the implications
of a low VIX then the VIX wouldn't be low!
The market's current over-valuation
means that an investment in the S&P500 Index is likely to yield a poor
return over the next 5 years, but the over-valuation tells us nothing about
what the market is likely to do over the next 3 months. However, when we
combine the over-valuation with the extremely low VIX we get a picture
of a market that is likely to yield a very poor return over the next several
months.
Prior to last week our expectation
was that the S&P500 Index and the Dow Industrials Index would experience
a sharp pullback and then rally to new highs for the year before embarking
on a major decline. However, as discussed in the latest Weekly Update last
week's action muddied the waters as far as our short-term view was concerned
by providing some evidence that a rally to new recovery highs was already
underway. This week's action has, in turn, provided some more evidence
that a new recovery high in the S&P500 Index will occur sooner than
previously anticipated.
If the S&P500 Index is already
on its way to a new recovery high then we would expect to see something
similar to what happened in June-July 1998. Notice, on the above chart,
how the S&P500 consolidated for 2-3 months during the second quarter
of 1998 before spiking higher into mid-July. Notice, also, the similarities
with the recent price action. With the VIX already at such a low level
it is very unlikely that a multi-month advance is about to begin, but a
5%-10% upward spike to a major peak over the next few weeks would not be
surprising.
Current Market Situation
In last week's Interim Update we mentioned
that the willingness of the market to ignore the poor results announced
by semiconductor equipment maker Applied Materials (NASDAQ: AMAT) and instead
to believe the positive spin of AMAT's senior management was a short-term
bullish factor. At the time we brushed this aside as not being significant
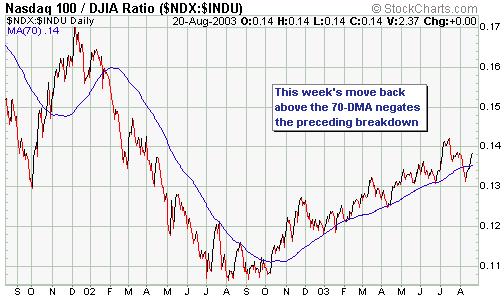
beyond the immediate-term because the NASDAQ100/Dow ratio had recently
triggered a bearish signal by closing below its 70-day moving average.
However, last week's willingness of market participants to embrace spin
over facts when it came to AMAT might have been more important than we
originally suspected. For example, over the first three days of this week
we've seen:
a) The NASDAQ100/Dow ratio move back
above its 70-day moving average, effectively negating the previous bearish
signal
b) The Semiconductor Index (SOX) break
out to the upside

c) The NASDAQ100 Index out-perform
the Dow Industrials Index on the day following very poor results from technology
giant Hewlett Packard
These are all signs that a lot of people
are presently willing to just close their eyes and buy. This is not a recipe
for a sustained advance, but it is a recipe for the type of upward spike
described above.
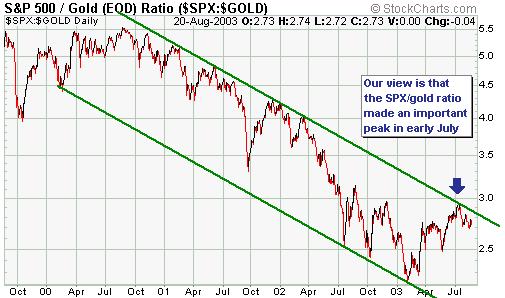
Importantly, the S&P500 in terms
of gold has continued to drift lower since peaking in early July (see chart
below). This, in turn, is evidence that we are seeing an inflation-driven
rally as opposed to a rally based on an expected real improvement in the
underlying fundamentals.
Gold and
the Dollar
Gold Stocks
In the latest Weekly Update we explained
that gold and gold stocks were about to either experience blow-off moves
to the upside or pull back, with the odds being marginally in favour of
upside blow-offs. The action over the first 3 days of this week has improved
the chances that we are about to see an upside blow-off in the gold market,
although with the XAU sitting right at major resistance as at Wednesday's
close it is still a bit of a coin toss. In any case, don't be too eager
to take profits on our favourite junior gold stocks because although these
stocks have moved up considerably over the past few months a better selling
opportunity probably lies in the future. If we get an upside blow-off then
such an opportunity will most likely arrive before the end of next month,
but if the market begins a pullback from around current levels then a good
selling opportunity might not present itself for at least another three
months.
The South African gold stocks have
been laggards over the past year thanks primarily to the strength in the
Rand. In the 11th August Weekly Update, though, we mentioned that the most
recent strength in the Rand could just be a test of the peak reached earlier
this year and that it wouldn't take much weakness to break the Rand's intermediate-term
up-trend. A downward reversal in the Rand would, in turn, be very bullish
for the SA gold producers.
The company with the greatest leverage
to the Rand gold price is Durban Deep, but as far as shareholders are concerned
we think this company is more trouble than it is worth. A better way to
play a potential trend reversal in the Rand would be via Harmony Gold (NYSE:
HMY). HMY is an extremely well managed company with good assets and a solid
balance sheet, but has under-performed due to its enormous exposure to
South Africa. However, it now sells at a substantial discount to Gold Fields
Ltd. (NYSE: GFI) and should make a large catch-up move if the Rand does
pullback. HMY might therefore be an interesting speculation for some of
our readers.
Current Market Situation
From the latest Weekly Update: "...it
would be typical for a sharp move up to resistance, as has just occurred
in the gold market, to be followed by a pullback even if price was ultimately
headed much higher. However, if gold is able to close above last week's
high at the end of the coming week then we would assume that an accelerated
move to above $400 was underway."
Last week's intra-day high in the December
gold contract was $368.80 and Wednesday's closing price was $367, so if
December gold can gain another $1.80 or more by the end of this week we
will assume that an accelerated move higher is in progress. In this case
resistance at around $410 (see monthly chart below) would become a reasonable
short-term target.
We expect the euro gold price to move
back to near the top of its long-term price channel, which would correspond
to around 370 euros if the channel top were reached during the next 3-4
months. As such, our intermediate-term target for the gold price is 370
euros. Assuming a euro/US$ exchange rate of 1.25 we therefore come up with
an intermediate-term US$ gold price target of $460. Obviously, a different
assumption regarding the euro/US$ rate would change our target for the
US$ gold price.
Over the past year we have generally
used charts of the euro gold price in preference to charts of the US$ gold
price to develop our upside gold price targets because the channel top
is well defined on the long-term euro gold price chart. The US$ gold price,
however, has tended to spike above the top of its upward-sloping channel
during the rallies.
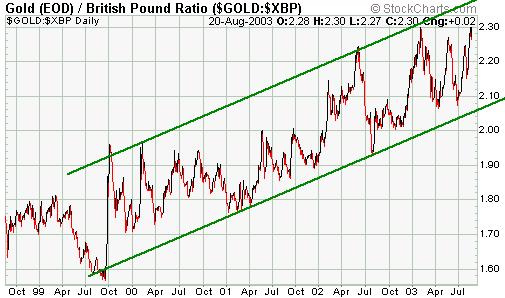
Interestingly, the gold price in terms
of the pound has also been moving higher within a well defined channel
over the past 4 years. The below chart suggests that 240 pounds is a reasonable
upside target for the gold price over the next few months.
In last week's Interim Update we made
the following comments about the Swiss Franc: "Another test of the 0.70-0.72
range over the next few weeks would not surprise us, but the rapid rate
at which commercial traders have purchased SF futures during the pullbacks
suggests that this support will hold. If support at 0.70 is breached then
a drop to 0.66 would become likely, but this is not a possibility we are
seriously considering at this stage. It would, however, be worth giving
serious consideration to such a possibility if the SF moved up to at least
0.76 and then dropped back to 0.72."
As the below weekly chart of SF futures
shows, the SF dropped back to the 0.70-0.72 support range earlier this
week. We continue to expect that this support will hold. Note that a weekly
close in the December gold contract above $368.80 would be a bullish omen
as far as the SF was concerned because gold has tended to lead the European
currencies over the past few years.
Update
on Stock Selections
 Aquiline
Resources (TSXV: AQI) has moved up a long way since we added it to the
Stocks List in April, but the stock's risk/reward is almost as good now
as it was back then. This is because the risk with the stock has been substantially
reduced by the drilling program completed by the company over the past
2 months. Also, we don't think the market has properly accounted for the
drill results announced to date and the clearly-stated plans of the company
to fast-track the Calcatreu project to production over the next 12 months.
Investors should continue to look for opportunities to accumulate AQI. Aquiline
Resources (TSXV: AQI) has moved up a long way since we added it to the
Stocks List in April, but the stock's risk/reward is almost as good now
as it was back then. This is because the risk with the stock has been substantially
reduced by the drilling program completed by the company over the past
2 months. Also, we don't think the market has properly accounted for the
drill results announced to date and the clearly-stated plans of the company
to fast-track the Calcatreu project to production over the next 12 months.
Investors should continue to look for opportunities to accumulate AQI.
In
the latest Weekly Update we mentioned that Cardero Resource (TSXV: CDU)
was interesting from a technical perspective and might be a suitable speculation
at its current price for those with a high tolerance for risk. Speculators
who took the opportunity to buy the stock on Monday would now have a decent
profit (the stock traded in the 0.83-0.87 range during most of Monday's
session and closed at 1.19 on Wednesday). The stock will probably move
higher in the short-term with resistance in the 1.40-1.50 being a reasonable
target, but we no longer consider it to be a speculative buy. Longer-term,
if the next set of drill results confirm the most recently released results
then CDU will move well above resistance at 1.50.
Stockbrokers
We often get asked to recommend US-based
brokers that can be used for the trading of stocks on the Canadian exchanges.
One broker that we've mentioned in the past that appears to offer a reasonable
service in this regard is Pennaluna and Company (www.penntrade.com). The
only problem we know of with Pennaluna is that it is not registered in
all states and is therefore not available to all of our US-based subscribers.
Another is Barry Murphy and Co. (www.barrymurphy.com),
a company based in Boston and registered in all 50 states. We've recently
had a couple of discussions with Mr Barry Murphy Jr., the owner of the
company, and believe that this company will be able to provide a good solution
for non-Canadians (including people in countries other than the US) wanting
to trade the junior gold/silver stocks (or any other stocks) on the Canadian
stock exchanges. Barry Murphy and Co. can offer a flat rate of US$29.95
for each trade on a Canadian exchange, regardless of the number of shares
traded or the price of the shares. Please contact Mr Damian Gates at Barry
Murphy and Co. on 1800 2212111 or 617 4261770 for further details. Note
that to get the above-mentioned flat rate you MUST identify yourself as
a Speculative-Investor subscriber. Please also note that we receive no
commissions or any other form of payment from any stockbrokers.
Chart Sources
Charts appearing in today's commentary
are courtesy of:
http://stockcharts.com/index.html
http://www.futuresource.com/
http://bigcharts.marketwatch.com/

|
