![]()
![]()
![]()
![]()
- Interim Update 20th September 2017
Copyright
Reminder
The commentaries that appear at TSI
may not be distributed, in full or in part, without our written permission.
In particular, please note that the posting of extracts from TSI commentaries
at other web sites or providing links to TSI commentaries at other web
sites (for example, at discussion boards) without our written permission
is prohibited.
We reserve the right to immediately
terminate the subscription of any TSI subscriber who distributes the TSI
commentaries without our written permission.
The Fed is
underestimating and overestimating
The Fed is underestimating the
importance of its balance-sheet reduction and overestimating the
importance of its baby-step rate hikes.
On Wednesday 20th September
the Fed did what we and most traders/observers were expecting, which is
leave its targeted interest rates unchanged and announce the October start
of its balance-sheet reduction program. The planned pace of balance-sheet
reduction will start at $10B/month and will increase by $10B every three
months to a maximum of $50B/month. That is, the pace of balance-sheet
reduction is expected to ramp up to $50B/month by October of next year.
Based on the words uttered by senior Fed representatives, the small
increases in the Fed's targeted interest rates are viewed as significant
monetary tightening whereas the balance-sheet reduction program is viewed
as largely a procedural matter that won't have a meaningful effect on the
monetary backdrop. However, it's actually the other way around.
We've been saying for years that the Fed's rate hikes did not constitute a
genuine tightening of monetary policy. In fact, due to changes implemented
since the Global Financial Crisis an official US rate hike now involves
the Fed pumping money into the commercial banking system rather than
taking money out of the banking system. It's not surprising, therefore,
that in the almost two years that have passed since the Fed kicked off its
rate-hiking program there have been no noticeable effects on the stock and
bond markets. In particular, since the first Fed rate hike in
December-2015 the S&P500 has continued to trend upward at roughly the same
pace and the 10-year T-Note yield is approximately unchanged.
The
balance-sheet reduction does, however, constitute a genuine tightening of
policy, the reason being that it removes money from the banking system and
the economy. Moreover, although the initial pace of balance-sheet
contraction will be slow it is happening at a time when a decline in
commercial-bank credit creation has already caused a substantial drop in
the US monetary inflation rate.
The Fed's balance-sheet reduction
program may therefore have a much bigger effect than the Fed expects.
The most absurd bubble
yet
Speculation in cryptocurrencies
may be the most absurd investment bubble in history. As far as we know,
never before have 'things' that can be created by almost anyone in
infinite amounts at effectively zero cost been valued so highly.
One of Bitcoin's biggest original selling points was that its maximum
supply was rigidly limited at 21M, but thanks to the "fork" that happened
last month it should now be obvious to everyone that this is not the case.
When Bitcoin "forked" last month the supply effectively doubled
instantaneously. The new 'coins' created by the "fork" are on a different
blockchain and are called "Bitcoin Cash" rather than "Bitcoin", but in all
other respects they are identical.
It has always been obvious that
the Bitcoin system or something virtually the same could be replicated ad
infinitum*, so the fact that the maximum supply of the original Bitcoin
was mathematically fixed was never a valid reason to be bullish. What has
amazed us is that the veritable explosion of cryptocurrency supply (there
are currently about 1,000 cryptocurrencies and new ones are coming into
existence at the average rate of more than two per week) hasn't yet
brought the rampant speculation to an end. In fact, it is clear that
Bitcoin benefited -- at least in price terms -- from the explosive growth
in the supply of alternatives, because in many cases the initial purchase
of the newly-created alternatives could only be made using Bitcoin.
As we've mentioned in the past, Bitcoin in particular and
cryptocurrencies in general have the potential to be useful as vehicles
for quickly and efficiently transferring purchasing-power (PP) outside the
banking system. However, they can only have this non-speculative use if
they have stable PP from one week to the next and governments allow them
to perform this function.
At the moment their PPs are all over the
place, so they cannot be used for anything except gambling. They are the
proverbial "trading sardines" -- a can of sardines that is unfit for
consumption but still gets shuffled around between speculators placing
bets on its future price. But what if some of them were to establish PP
stability and therefore become genuinely useful as media of exchange?
Would governments that are now determined to monitor all financial
transactions as part of their increasingly desperate efforts to obtain
every last tax dollar sit back and do nothing? Not likely.
We
stated above that the rampant speculation in cryptocurrencies hasn't
ended. We'll know it has ended when it becomes impossible to successfully
launch new 'cryptos' and the existing ones begin to disappear, that is,
when supply begins to shrink. However, it's possible that the Bitcoin
price made its ultimate peak when it touched $5000 on 2nd September.
Possible, but far from certain.
From an interim low of $1837 on
16th July, Bitcoin traded as high of $5013 on 2nd September. It then
traded as low as $2951 on 15th September before recovering to trade as
high as $4081 on 19th September. Refer to the following weekly chart from
coindesk.com for additional details. In other words, beginning in mid-July
Bitcoin's purchasing power went up by 173% in 7 weeks, down by 41% in 2
weeks and then up by 38% in only 4 days.
Incredibly, this sort of
volatility is not out of the ordinary for a cryptocurrency. This means
that as media of exchange they are useless. They are 'trading sardines',
not 'eating sardines'.
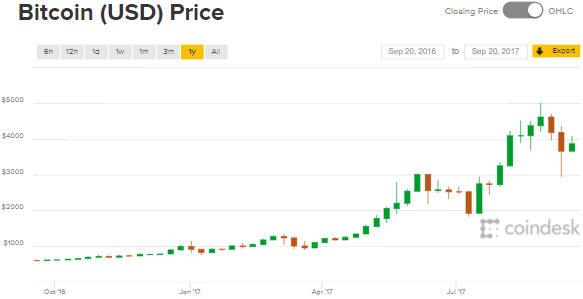
If Bitcoin fails to exceed its early-September high of $5013 and then
closes below its mid-September low of $2951, we will have evidence that
the ultimate price peak is in place. Until then almost anything is
possible, because this is primarily a play on the madness of crowds and
crowds can become very mad before sanity strikes.
*We mentioned this point in one of our first discussions of Bitcoin
back in 2013. Here's what we wrote at that time: "...whereas there are
strict limitations on the supplies of both gold and Bitcoins, there is an
infinite supply of things that are identical to Bitcoins in every way
except name. The Bitcoin network can be duplicated ad infinitum, which
means that maintaining a high value for a Bitcoin involves maintaining the
belief that there is a significant difference between a Bitcoin and the
other digital currencies that are created using the same coding, when in
reality no such difference exists."
The Stock Market
That the US stock market is yet
to react to the tightening of monetary conditions caused by the slowing
rate of commercial-bank credit creation and didn't react at all to the
Fed's first step in the direction of monetary tightening doesn't mean that
it is immune to what's happening on the monetary front. The US stock
market is actually the market most vulnerable to tighter monetary
conditions because it is the market that has been elevated the most by
loose monetary conditions and is now the most over-valued.
The
tightening of monetary conditions will chip away at the stock market and
will eventually have a devastating effect. In the meantime, the bull
market seems to be climbing a wall of 'worryfreeness'. It isn't the
traditional wall of worry because nothing seems to bother this market.
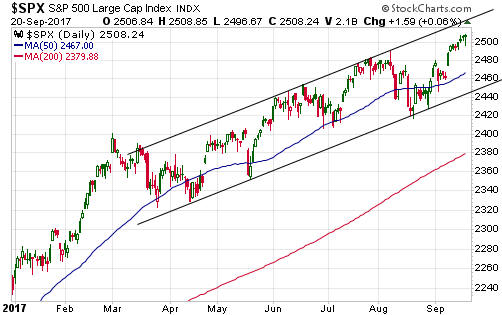
Turning to the charts, the SPX was up 0.06% in response to Wednesday's
information from the Fed. As illustrated below, this prolonged a sequence
of very small daily moves since the upside breakout that occurred 8
trading days ago.
Let's see what happens over the final two trading
days of this week. The channel drawn on the following chart suggests the
potential for a spike up to around 2530, but the lack of momentum since
the 11th September upside breakout suggests that there is still the
potential for a breakout failure.
Gold and the Dollar
Gold
Current Market Situation
We have
written that we view a T-Bond sell-off as the biggest short-term threat to
the gold market. The reason is that in the absence of an offsetting rise
in inflation expectations a T-Bond sell-off would make the fundamental
backdrop less bullish for gold. It could even quickly shift our Gold True
Fundamentals Model (GTFM), which was decisively in bullish territory as
recently as last week, into bearish territory.
A T-Bond sell-off
could have this effect on the GTFM because it could turn three of the
GTFM's seven components from bullish to bearish, thus shifting the overall
balance. The components that probably would be adversely affected (from
gold's perspective) are the real interest rate (without an offsetting rise
in inflation expectations, a higher nominal rate means a higher real
rate), the relative strength of the banking sector (in the short-term the
banking sector tends to be relatively strong (bearish for gold) when
interest rates are rising), and credit spreads (rising Treasury yields
result in narrower credit spreads (bearish for gold) unless there is an
offsetting rise in junk-bond yields).
The T-Bond price decline of
the past two weeks shifted the three GTFM components mentioned above in
the gold-bearish direction, although not by enough to flip any of them
from bullish to bearish. We were concerned that the market reaction to the
Fed's 20th September monetary statement would cause the T-Bond price to
accelerate downward, but this didn't happen. Consequently, the gold price
managed to hold above lateral support at $1300 and the SPDR Gold Shares
ETF (GLD) managed to hold above equivalent lateral support near $123.
The following daily chart shows that GLD's initial test of lateral
support was successful. However, it also shows that GLD has just closed
below its 20-day MA for the first time since mid-July, which is a sign of
weakness.
Another sign of weakness is the performance of the gold-mining sector
relative to gold. As illustrated below, the HUI/GLD ratio has broken
solidly below both its 150-day and 40-day MAs.
Due to the aforementioned signs of weakness and the strong potential
for the T-Bond to extend its price decline, there is a high risk that gold
will break below $1300 before this correction runs its course. Below $1300
there is support in the high-$1280s defined by the 50-day MA and support
in the low-$1240s defined by the 200-day MA.
Insurance Update
In the latest
Weekly Update, we wrote:
"With gold sentiment now a little
stretched into the realm of optimism, the HUI below its 20-day MA for the
first time in more than a month, the HUI/gold ratio showing less strength
than desired and the Fed probably about to take its first step along the
monetary-tightening path, it could be appropriate to do some short-term
hedging of gold investments. We aren't going to make any specific
suggestions, but in general terms the hedging could take the form of GLD
or GDX October put options or the purchase of a leveraged gold-mining bear
fund such as DUST or JDST (our preference would be the put options). If
gold were to get through 'Fed day' unscathed then the hedges could be
exited as soon as this Thursday."
We ended up buying some
insurance in the form of GLD October $122 puts soon after the start of
trading on both Tuesday and Wednesday.
All things considered, the
gold market got through 'Fed day' without suffering serious damage but
certainly not unscathed. Our plan is to hold the insurance for now and see
what happens over the final two days of this week.
Since we are
heavily 'long' the gold-mining sector our preference would be for gold to
hold the $1300 support level, but we aren't confident this will happen. If
$1300 is breached and there is acceleration to the downside then the GLD
puts will cushion the blow.
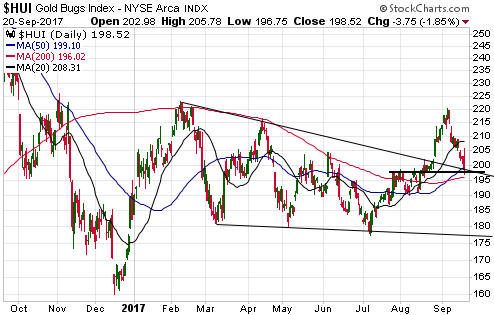
Gold Stocks
The
HUI has fallen below 200, but 200 is not the most important nearby support
level. The most important nearby support lies a little lower -- at 197.5.
This support held on Wednesday 20th September, keeping alive the
possibility that the recent price action is simply a pullback to test
August's upside breakout.
That the HUI is in the process of
completing a successful test of the August break to the upside will remain
a realistic possibility as long as 197 holds on a daily closing basis.
However, considering the performance of the HUI/gold ratio and gold's
vulnerability as discussed above, this possibility is not the most likely
scenario. Instead, it's beginning to look like a multi-month top was put
in place in early-September and that the gold-mining indices will decline
in choppy fashion for at least another 2 weeks.
Although the price action of the past several days has changed our
short-term expectations it hasn't changed what we expect to happen over
the next 9 months. We continue to expect that gold and gold-mining stocks
will do well over this period, but not as well as industrial-metals and
industrial-metals-mining stocks.
The Currency Market
The Dollar Index (DX) is making another attempt to signal a short-term
bottom and reversal.
Although it is yet to be confirmed by the price action, we assume that
the DX made a short-term bottom about two weeks ago. If so, the DX began
to trend upward on a short-term basis at the same time as it signaled an
end to its cyclical bull market.
It is not uncommon for
confirmation of a trend shift in one direction over one timeframe to be
quickly followed by a reaction in the opposite direction over a shorter
timeframe. This is especially so if confirmation of the trend shift occurs
when sentiment and momentum are stretched, which is the recent situation
with the DX.
In the DX's case, a nail was driven into the bull
market's coffin two weeks ago when it closed below its 200-week MA and
lateral support defined by its 2016 low. However, the fact that this
happened with the DX at an 'oversold' extreme in both momentum and
sentiment terms set the stage for a multi-week, or perhaps even a
multi-month, rebound to get underway almost immediately.
Updates on Stock Selections
Notes: 1) To review the complete list of current TSI stock selections, logon at
http://www.speculative-investor.com/new/market_logon.asp
and then click on "Stock Selections" in the menu. When at the Stock
Selections page, click on a stock's symbol to bring-up an archive of
our comments on the stock in question. 2) The Small Stock Watch List is
located at http://www.speculative-investor.com/new/smallstockwatch.html
Chart Sources
Charts appearing in today's commentary
are courtesy of:
http://stockcharts.com/index.html
![]()