|
- Interim Update 21st January 2004
Copyright
Reminder
The commentaries that appear at TSI
may not be distributed, in full or in part, without our written permission.
In particular, please note that the posting of extracts from TSI commentaries
at other web sites or providing links to TSI commentaries at other web
sites (for example, at discussion boards) without our written permission
is prohibited.
We reserve the right to immediately
terminate the subscription of any TSI subscriber who distributes the TSI
commentaries without our written permission.
Money Supply
and Interest Rates
A few years ago we noticed that intermediate-term
trend changes in the T-Bond yield led trend changes in the year-over-year
money-supply (MS) growth rate by about three months. This lead-lag relationship
is depicted on the below charts. Note that the scale on the bond yield
chart has been inverted so peaks actually represent interest-rate lows
(the chart, as drawn, shows the direction of bond prices) and that
the charts have been offset by about 3 months.
The MS-bond relationship has served
us well because whenever a trend change has been confirmed in the bond
market we have been able to correctly anticipate a corresponding change
in the money-supply growth trend. For example, as soon as the bond yield
began to surge last June the lead-lag relationship told us to expect a
downward reversal in the money-supply growth rate by September. As it turned
out, the actual peak in the year-over-year M2 growth rate occurred in late
August.
Further to the above, the directional
change in the money-supply growth trend that began towards the end of August
last year was foreseeable. What wasn't foreseeable -- at least from our
perspective -- was the magnitude of the drop in the money-supply
growth rate, although the dramatic decline is consistent with the observation
that it has become a lot more difficult to stimulate money-supply growth
over the past two years. In particular, since early 2002 falling interest
rates have had a lesser positive effect on money-supply growth while rising
interest rates have had a greater negative effect. This is one reason why
the Fed will be doing everything in its power to prevent bond yields from
moving sharply higher.
By the way, the above charts suggest
that we will probably see a bounce in the M2 growth rate over the next
few months, but unless bonds surprise us by moving above last year's high
the money-supply growth trend should remain down.
The US
Stock Market
What everyone knows...
Almost everyone knows that there will
not be a large downward move in the US stock market until after the November
elections, but what almost everyone knows is seldom worth knowing. We are
prepared to make a sizeable bet that this consensus view of the world --
the view that it will generally be smooth sailing for the market until
November -- will prove to be about as wrong as it could possibly be. We're
just not prepared to make that bet right now because the most likely path
appears to be a pullback followed by a rally to a new high before the trouble
begins.
The main problem facing the stock market
is that it is priced for perfection, meaning that it is acutely vulnerable
to something going wrong. And there are a lot of things that could go wrong
over the next 6-12 months, one of which is on-going strength in the oil
price.
Our bearish one-year outlook for the
stock market is not based in any way on a strong oil price (our expectation
has been that the oil price would weaken). However, if the oil price does
remain strong for several more months then this will add to the bearish
case because it will be the equivalent of a tax hike for US households
and businesses. In other words, any additional benefit that would have
occurred this year as a result of Bush's tax cuts would potentially be
offset by higher energy costs.
By the way, a rising oil price can
never have an inflationary effect -- notwithstanding the consensus view
to the contrary -- unless the Fed monetises the increase in the oil price.
Right now, though, the intermediate-term money-supply growth trend is down
so it is doubtful that the US financial establishment could lend enough
new money into existence to allow the economy to absorb a large rise in
energy costs in a relatively painless way. In the current environment a
sustained increase in the oil price would be neither inflationary nor deflationary,
it would simply be a drag on the economy.
But what if the money-supply growth
trend were to reverse sharply higher over the coming months, in effect
allowing other prices to rise in concert with energy prices? In this case
the negative effects on the economy and the stock market would be less
immediate and less direct, but the heightened fear of inflation that would
no doubt stem from a broad-based rise in prices would bring about a substantial
increase in long-term interest rates. This, in turn, would be a major problem
for the stock market because the widespread belief that interest rates
are going to remain low is probably the single most important factor supporting
current stock market valuations.
Of all the things that could go wrong
for the stock market over the next 6-12 months a substantial increase in
long-term interest rates -- regardless of whether the increase is related
to higher energy prices or to something else -- is, in our view, the most
likely. In fact, if a substantial increase in long-term interest rates
does occur it will probably be associated with something other than rising
energy prices because, as explained in previous commentaries, oil prices
and long-term interest rates have been inversely correlated over the past
two years. Instead, a sharp rise in long-term interest rates over the remainder
of this year would more likely be associated with the withdrawal of foreign
central-bank support for US bonds and/or continuing across-the-board strength
in commodity prices due to strong demand from Asia.
Why would higher interest rates be
such a problem for the stock market?
The short answer, as mentioned above,
is that the widespread belief that interest rates are going to remain at
a very low level is probably the single most important factor supporting
current stock market valuations. And we aren't just referring to the fact
that the lower the interest rate the greater the present value of future
company earnings. Of great relevance is also the competition for investment
between stocks and bonds and between low-risk/low-yield debt and high-risk/high-yield
debt. Pension fund managers, for example, are under pressure to generate
returns of 8-10% per year in order to satisfy the assumptions built into
corporate financial statements. These assumptions will prove to be unrealistic
over the long-term and will eventually need to be ramped down, but in the
mean time the fund managers must try to obtain a return on investment equivalent
to twice the yield on 10-year Treasuries. And the only way to do this is
to buy riskier assets such as stocks and lower-quality debt securities.
However, should the yield on a 10-year Treasury rise from the current level
of 4.1% to, say, 6.5%, then the game changes because these people who,
as a group, manage hundreds of billions of dollars will be able to allocate
a larger portion of their funds to the lowest-risk securities without sacrificing
a huge amount of performance. A result would be a massive re-allocation
of money from riskier investments that offer the potential for higher returns
to investments that offer greater safety.
Apart from higher interest rates and
oil price strength, things that could go wrong include an accelerated fall
in the US$, a continuing decline in the money-supply growth rate, and a
successful terrorist attack against the US.
It is, of course, possible that nothing
will go wrong over the remainder of this year and the stock market will
simply work its way higher between now and the elections with just routine
pullbacks along the way. Trouble is, everything must go right for the market
to end the year higher than where it began whereas only one thing needs
to go wrong for a large decline to occur. To use a coin-tossing analogy,
someone who is bullish on the US stock market as far as the coming year
is concerned is effectively expecting to call five out of five coin tosses
correctly whereas someone who is bearish is only expecting to call at least
one out of five coin tosses correctly.
Current Market Situation
There is no change to our short-term
view; we expect that a pullback will begin soon and that this pullback
will be followed by a rally to a new recovery high.
Although we see very little upside
potential in the senior stock indices and considerable downside risk as
far as the coming year is concerned, it will be important that we not to
be so dogmatically bearish on the market that we overlook the good buying
opportunities that will almost certainly emerge from time to time in individual
sectors. After all, it is rare for all sectors of the market to fall at
the same time. In fact, even during severe bear markets the periods during
which all stock-sectors are plummeting tend to be very short. Instead,
during any 6-month period there is usually at least one sector of the market
that is performing well.
At the moment, our long-side speculations/investments
are focused on gold stocks and non-gold commodity stocks. However, over
the course of this year that might change.
Gold and
the Dollar
Gold Stocks
Our expectation is that the rebound
in the gold sector that began last Thursday will be followed by another
downward leg and that a correction low will be in place by the end of February
at the latest (most likely within the next three weeks). We've previously
mentioned a downside target of 190 for the AMEX Gold BUGS Index (HUI),
but of greater significance than the HUI reaching any specific price level
will be gold-stocks reaching an oversold extreme relative to the gold price.
As outlined in the latest Weekly Update, we would classify a drop in the
HUI/gold ratio to 13% below its 40-day moving average as an oversold extreme.
Last year the XAU broke upwards out
of a 6-year base formation (see weekly chart below), in the process creating
a target of 135 (equivalent to about 300 for the HUI). The XAU therefore
has some unfinished business to attend to on the upside, although even
if this technically-based target is valid it wouldn't necessarily have
to be achieved this year. As far as the next few weeks are concerned a
drop back to the top of the former basing pattern (85-90) would not be
surprising.

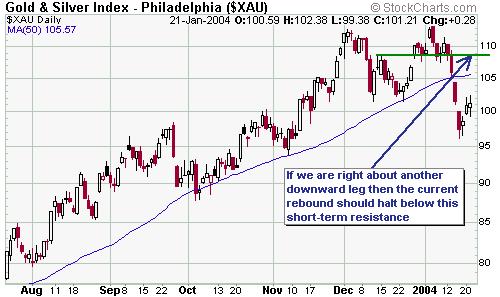
Below is a daily chart of the XAU.
If we are right about there being one more downward leg before a correction
low is put in place then the current rebound is likely to fail at, or below,
the 50-day moving average (presently at 105.6). The XAU could, however,
move up to short-term resistance in the 108-109 area (equivalent to about
245 for the HUI) without invalidating the idea that new correction lows
were in store over the coming weeks. We would consider a daily close above
109, though, to be strong evidence that the correction was over.
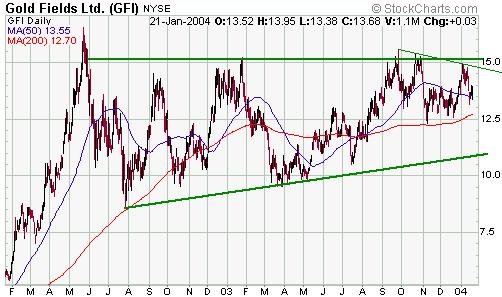
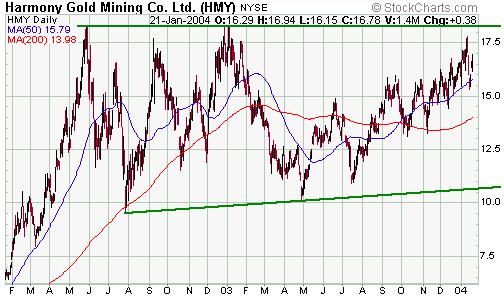
While the stocks of some high-profile
North American gold producers -- GG and RGLD spring to mind -- are breaking
down quite badly, the stocks of the unhedged South African majors (HMY
and GFI) appear to be readying themselves for moves to new all-time highs.
These stocks have been in consolidation since June of 2002 and effectively
'sat out' last year's rally in the gold sector, but their chart patterns
are now shaping up quite bullishly (see below). Furthermore, they are under-valued
relative to their NA counterparts.
Both stocks have some work to do to
overcome the resistance that lies about 10-15% above their current prices,
but the next big moves for these stocks will probably be to the upside.
If upside breakouts from their 20-month-long consolidation patterns do
occur then $20 for GFI and $26 for HMY would be reasonable objectives over
the ensuing 3-6 months.
As promised in the latest Weekly Update,
below is a table of gold/silver stocks -- some that are currently in the
TSI Stocks List and some that aren't -- that might be suitable for new
buying as the correction in the gold sector winds its way to a conclusion.
There are many other stocks that deserve to be included in this table,
but we didn't think that adding more choices would add any more value.
Next to each stock we've suggested
an under-the-market ST (short-term) buy price, but please note that these
prices should not be interpreted as targets. Rather, the suggested buy
prices are simply levels at which the stocks would probably work well if
purchased as 3-month trades. Long-term investors who aren't concerned about
monthly fluctuations in stock prices could, however, buy these stocks now
because from a valuation perspective they look attractive at their current
prices.
| Symbol |
Stock
Exchange |
Company
Name |
|
Recent
Price $ |
ST
Buy Price $ |
| AUY |
AMEX |
Yamana Gold |
US$ |
2.42 |
2.00 |
| AZS |
TSXV |
Arizona Star |
C$ |
4.72 |
4.20 |
| BTV |
ASX |
Batavia Mining |
A$ |
0.14 |
0.13 |
| CBD |
TSX |
Cumberland Resources |
C$ |
4.20 |
3.70 |
| CCM |
TSX |
Canarc Resource |
C$ |
0.82 |
0.76 |
| DROOY |
NASDAQ |
Durban Deep |
US$ |
3.68 |
3.20 |
| DSM |
TSX |
Desert Sun Mining |
C$ |
1.50 |
1.30 |
| GFI |
NYSE |
Gold Fields |
US$ |
13.68 |
13.00 |
| HMY |
NYSE |
Harmony Gold |
US$ |
16.78 |
15.00 |
| MRB |
AMEX |
Metallica Resources |
US$ |
1.63 |
1.50 |
| NG |
AMEX |
NovaGold |
US$ |
5.49 |
4.70 |
| NXG |
AMEX |
Northgate Exploration |
US$ |
2.16 |
1.75 |
| RSGO |
ASX |
Resolute Company Options |
A$ |
0.67 |
0.60 |
| TKO |
TSXV |
Taseko Mines |
C$ |
2.00 |
1.50 |
| WTZ |
AMEX |
Western Silver |
US$ |
5.25 |
4.30 |
| XRC |
TSXV |
Exeter Resources |
C$ |
1.11 |
1.05 |
By the way, we've included DROOY in
the above list because it looks good from a technical perspective and because
we know that many of our readers follow this stock. However, we see no
reason to buy DROOY as a longer-term investment when Harmony Gold -- a
company with vastly superior management and assets -- offers almost as
much leverage to the gold price. DROOY can, though, be a good stock to
trade from time to time.
Current Market Situation
Below is a daily chart of March euro
futures. The euro's rise during the final two months of last year was both
relentless and orderly, but we are finally beginning to see the sort of
disorderly price action in the currency market that we'd expect to see
near an intermediate-term extreme (high for the euro, low for the dollar).
As explained in previous commentaries,
we don't think the euro has yet reached an intermediate-term peak against
the US$. However, the euro's next intermediate-term peak is unlikely to
be substantially above the high reached during the first half of January.
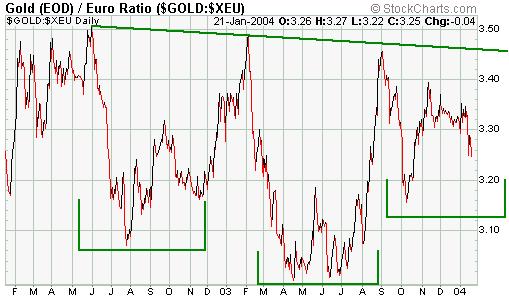
Below is a chart of the euro gold price
showing the potential head-and-shoulders bottom that has formed over the
past 18 months. We say "potential" because the pattern won't be confirmed
until/unless the gold price moves above 350. The below chart has considerable
bullish potential in that a break above the downward-sloping neckline --
something we expect will occur during the first half of this year ñ
would project a move up to around 390 (63 euros above yesterday's closing
price). On the other hand, the downside risk at the present time appears
to be limited to 15-20 euros.
Copper has out-performed gold since
the beginning of last year and the copper/gold ratio recently broke upwards
out of a 2-year base, projecting a continuation of copper's out-performance
over the coming 12 months. We do, however, think there is greater short-term
downside risk in copper than in gold. There are two reasons for this. First,
copper is vulnerable to any lowering of economic growth expectations. Second,
gold is already well into its correction whereas copper has just spiked
to a new multi-year high.
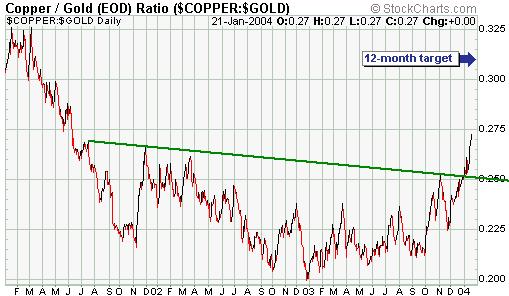
Chart Sources
Charts appearing in today's commentary
are courtesy of:
http://stockcharts.com/index.html
http://www.futuresource.com/
http://bigcharts.marketwatch.com/

|
