|
- Interim Update
21st January 2015
Copyright
Reminder
The commentaries that appear at TSI
may not be distributed, in full or in part, without our written permission.
In particular, please note that the posting of extracts from TSI commentaries
at other web sites or providing links to TSI commentaries at other web
sites (for example, at discussion boards) without our written permission
is prohibited.
We reserve the right to immediately
terminate the subscription of any TSI subscriber who distributes the TSI
commentaries without our written permission.
Real
Performance Comparison
Two or three times per year we present a set of
"inflation"-adjusted (IA) charts to show how some important markets
have performed after accounting for the long-term effects of US$
depreciation. Now, for the first time, we are presenting a single
chart that compares the long-term 'real' performances of several
markets. This chart makes some interesting points.
One of the most interesting points is that market volatility
increased dramatically in the early-1970s when the current monetary
system was ushered in. This shows that the generally higher levels
of monetary inflation and the larger variations in the rate of
monetary inflation that occurred after the official link to gold was
abandoned didn't only affect nominal prices. Real prices were
affected in a big way and boom-bust oscillations were hugely
amplified. As an aside, economists of the Keynesian School are
oblivious to the swings in relative 'real' prices caused by monetary
inflation and the depressing effects that these policy-induced price
swings have on economic progress.
A second point is that commodities in general (the green line on our
chart) have experienced much smaller performance oscillations than
the two monetary commodities (gold and silver). This is consistent
with a statement we made in an earlier commentary -- that there
aren't really any long-term broad-based commodity bull markets, just
gold bull markets in which most commodities end up participating.
A third point is that apart from the CRB Index, the markets and
indices included in our chart have taken turns in leading the real
performance comparison. The chart shows that gold is the current
leader, closely followed by the Dow Industrials Index (since
January-1959, the percentage gain in gold's real price is slightly
greater than the percentage gain in the Dow's real price). However,
if dividends were included, that is, if total returns were
considered, the Dow would currently be in the lead. This will
change.
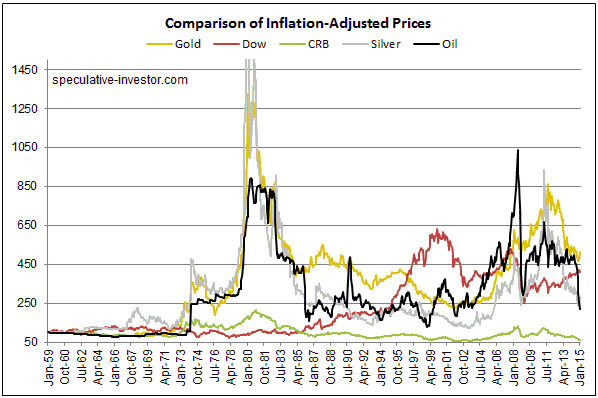
Chart Notes:
1) As advised in many previous commentaries, we use a method of
adjusting for the effects of US$ inflation that was first described
in a 2010 article (http://www.321gold.com/editorials/saville/saville121510.html).
This method isn't reliable over periods of two years or less, but it
should come close to reflecting reality over the long term.
2) To make it easier to compare relative performance, the
January-1959 starting value of each of the markets included in the
above chart was set to 100. In other words, the chart shows
performance assuming that each market started at 100.
3) The monthly performance of the scaled IA silver price peaked at
more than 2600 in early-1980, but for the sake of clarity the
chart's maximum Y-axis value was set to 1500. In other words, the
chart doesn't show the full extent of the early-1980 upward spike in
the IA silver price.
The
giant con-game has suffered only a minor setback
Paul Krugman unwittingly reveals the bankruptcy
of Keynesian economic theory on almost a weekly basis. Classic examples include
his statement in 1998 that in order to facilitate an economic recovery in Japan
the Bank of Japan needed to credibly promise to be irresponsible (a statement of
which he remains proud to this day), and his 2011 suggestion (repeated in 2012
and 2013, obviously because he thought it was a smart idea) that the US should
prepare for an alien invasion on the basis that the wasteful spending associated
with such an endeavour would help the economy. He continued the pattern in a
recent NY Times column about the Swiss National Bank's decision to remove
the euro peg, by lamenting that the SNB move could have the deleterious effect
of causing people around the world to question the general commitment of central
bankers to currency depreciation. Apparently it would be a disaster if a
critical mass of people came to believe that central banks would NOT risk
destroying their currencies in their efforts to boost the fictitious Keynesian
fixation known as "aggregate demand".
Unfortunately, the economies and financial markets of the world are sufficiently
fragile that what Krugman says can have an effect. In this case, however,
Krugman's silly comments don't matter, because the SNB action constitutes only a
minor setback for the giant con-game known as central banking. After all,
Switzerland's central bankers haven't exactly rededicated themselves to sound
money; they've just made sure that the fate of the Swiss franc (SF) isn't tied
to the fate of the euro. Other than that, they are continuing to toe the party
line by aggressively inflating the SF supply and keeping interest rates at
ridiculously-low levels. Furthermore, confidence in the Fed does not appear to
have been materially dented by the SNB move. Gold shot higher in US$ terms, but
this was a reaction to perceived problems with the euro.
Uranium Update
The uranium market wasn't able to sustain the
November-2014 break above $40. The lack of reaction by the uranium mining stocks
to the surge above $40 was therefore correct.
The spot price is currently around $36/pound. The mid-$30s appears to be the
'right' price at this time, with last year's plunge to the high-$20s and surge
into the $40s being aberrations.
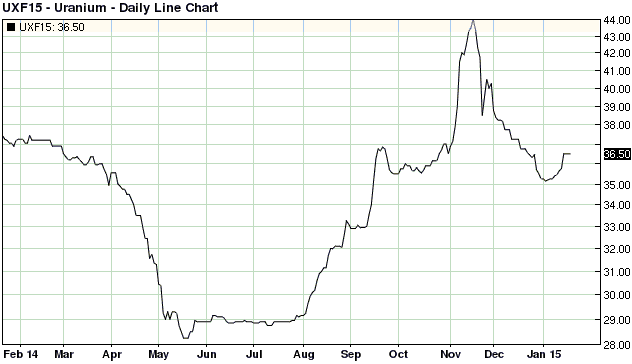
We expect that the spot uranium price will work its way up to around $50 by
year-end, with the bulk of the gain coming in the second half of the year. Also,
although a sizable portion of today's uranium production is uneconomic at the
current spot price, we expect that the price recovery will be related more to
increased demand than reduced supply.
The increase in the demand for uranium is expected to stem from reactor
re-starts in Japan, a concerted shift towards nuclear power generation in China
as part of a plan to address that country's massive pollution problems, and
rebounds in fossil-fuel prices.The Stock Market
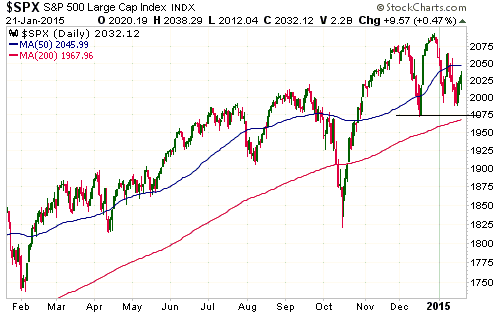
The US
At this stage the SPX's decline from its late-December peak looks like a routine
short-term pullback. A daily close below support at around 1970 would be the
first sign that it is something more serious.
Europe
France's CAC40 Index has broken its sequence of declining tops. It will be
interesting to see if the breakout is sustained after the ECB news due later
today (Thursday).
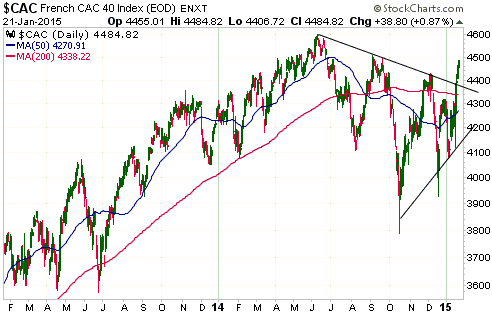
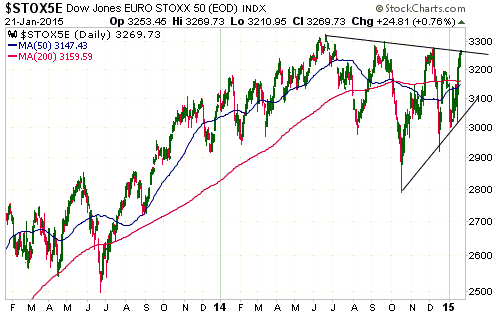
As the financial world waits with bated breath for definitive information
regarding the size of the ECB's new pro-inflation program, the EURO STOXX 50
Index, Europe's equivalent to the Dow Industrials Index, is poised at
intermediate-term trend-line resistance. Will it break out or will it reverse
lower and maintain its sequence of declining tops? We'll soon find out.
Gold and the Dollar
Gold
Another peg change that could affect the gold market
Last week's elimination of the SF's peg to the euro caused the gold price to
rally in terms of the euro and the US$. The price rise means that the global
demand for gold moved a little higher, probably due to what the SNB's decision
implied about the ECB. After all, if the Swiss National Bank has no confidence
in the ECB, then why should anyone?
Another currency peg that looks vulnerable is that of the Chinese Yuan to the
US$. As the US dollar appreciated against all other currencies over the past 6
months, so, thanks to the Yuan-US$ peg, did the Yuan. Considering that China's
policy-makers are labouring under the same wrongheaded notions about the drivers
of economic growth as their Western counterparts, it's a good bet that the
Chinese are now feeling a strong desire to weaken their currency. Consequently,
unlike the sharp upward re-valuation of the SF that occurred after the euro peg
was abandoned, a change to the Yuan-US$ peg, when it eventually comes, will
almost certainly involve a downward re-valuation of the Yuan.
When this happens it could generate fear that the world is headed for an all-out
currency war. Since the economic illiterates that run the Fed would feel
obligated to join such a war, a likely result would be a large increase in the
demand for gold.
Current Market Situation
The ECB's decision regarding a new and 'improved' asset monetisation program
will be announced a few hours after this commentary is published. We don't know
what the ECB will announce or what the gold price will do in the immediate
aftermath of the announcement, but we suspect that if the gold price doesn't
make a multi-week high this week then it will do so next week. Also, although it
is not 'supposed' to happen this way, we won't be surprised if an interim top in
the gold price coincides with an interim top in the Dollar Index.
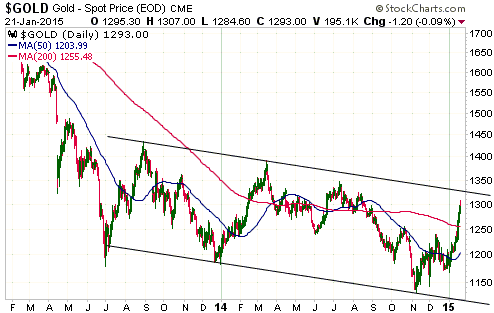
With regard to nearby resistance and, therefore, near-term upside targets, there
is the top of an intermediate-term channel at around $1325 (refer to the
following chart for details) and important lateral resistance at $1350. We think
that the higher of these resistance levels should currently be viewed as the
maximum realistic upside target for gold during the first quarter of this year.
Regardless of whether it has already begun or begins after a move up to near
$1350, a routine multi-week correction would be expected to take the gold price
down to around $1250.
Gold Stocks
In the email sent to subscribers on Tuesday night EST (Wednesday morning our
time), we wrote:
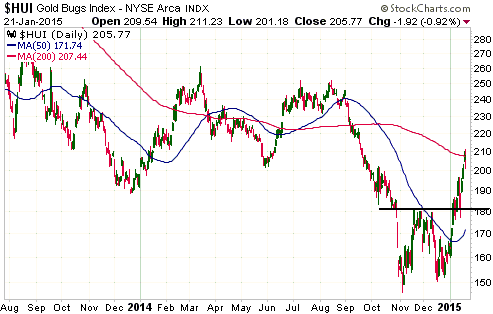
"The gold-mining sector is not yet short-term 'overbought', but the HUI has
reached its 200-day MA. This means that it has reached the minimum objective we
had in mind for the rally of the past several weeks. It could move higher as the
markets anticipate and then react to the outcomes of this Thursday's ECB meeting
and Sunday's elections in Greece, but we aren't expecting a sustained rise above
the 200-day MA to happen in the near future.
The upshot is that it's time for investors with substantial exposure to the
gold-mining sector to START taking some money off the table. Bear in mind that a
short-term selling opportunity is a short-term selling opportunity, regardless
of your cost."
After a market has suffered a large decline, a rebound to the vicinity of the
200-day MA is the most that can reasonably be expected from the INITIAL rally.
It could go a bit higher, but a market that has just suffered a sharp fall after
having spent years in a bearish trend is unlikely to rally back to the 200-day
MA and then just keep going. That's regardless of whether the rally is part of a
new bull market or a bear-market rebound. If the rally is part of a new bull
market then the rise to the 200-day MA (or a little higher) will typically be
followed by a pullback or a sideways consolidation lasting at least 4 weeks. The
start of a new bull market would then be signaled by a solid break above the
high of the initial rally.
With the HUI having reached both its 200-day MA and the chart-based target
created by the break above short-term resistance at 180, it's likely that a
multi-week correction will begin this week or next week.
The Currency Market
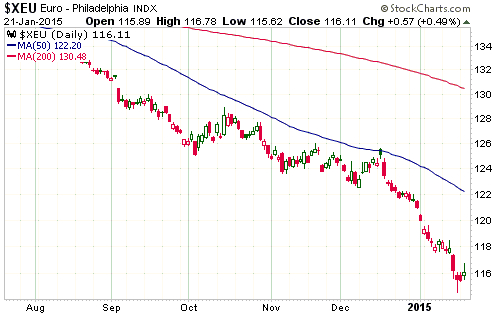
We are expecting that there will be an upward reversal in the euro within the
next few days almost regardless of what the ECB decides at its 22nd January
meeting.
Updates
on Stock Selections
Notes: 1) To review the complete list of current TSI stock selections, logon at
http://www.speculative-investor.com/new/market_logon.asp
and then click on "Stock Selections" in the menu. When at the Stock
Selections page, click on a stock's symbol to bring-up an archive of
our comments on the stock in question. 2) The Small Stock Watch List is
located at http://www.speculative-investor.com/new/smallstockwatch.html
Chart Sources
Charts appearing in today's commentary
are courtesy of:
http://stockcharts.com/index.html
http://bigcharts.marketwatch.com/

|
