|
- 21 March 2001
Death Spiral
in Japan
The above was the title of an article
that appeared in the latest edition of Barrons. The following quote sums
up the message of the article:
Japan's banking woes, already well-known
to Asian investors, will surely escalate. Todd Jacobson, who steers Warburg
Pincus Japan mutual fund, calls Japan's problems "extreme: The economy
is very bad, and there's no wiggle room left to sell equities to buttress
your capital base." Says Jacobson: "The most likely scenario is we will
see at least one bank nationalized in the next six months."
Articles such as the above are a contrarian's
dream since they usually appear near major bottoms. Time will tell if this
article was another great contrarian BUY signal, but negativity surrounding
Japan's financial situation could hardly be more extreme.
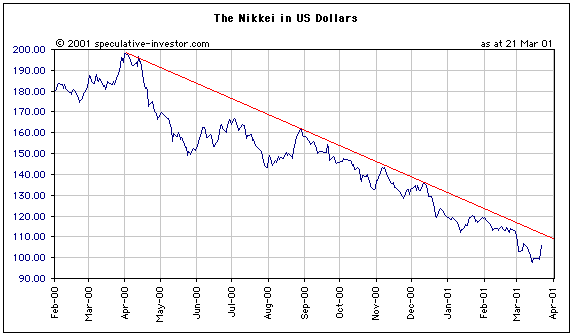
Below is an updated version of a chart
we have included in previous commentary. The chart shows the Nikkei225
in US Dollars (the Japanese stock market from the point of view of a US
investor) and, as previously noted, we plan to turn bullish on the Japanese
stock market when the downtrend line on this chart is broken. Although
the Nikkei has rallied sharply this week, the downtrend remains in tact.
A move by the Nikkei/Yen ratio to around 110 (with Dollar-Yen at 123 this
would require a move to 13600 on the Nikkei) would turn us bullish. (Note
that a chart of the Nikkei in Yen, rather than US Dollars, would show a
break of the downtrend as a result of yesterday's sharp rally. However,
from the perspective of a foreign investor there is little point buying
Japanese stocks if stock market gains are going to be offset by currency
market losses.)
The big news coming out of Japan this
week is that the BOJ is now specifically targeting inflation, that is,
they now have a stated objective to increase the rate of inflation.
This has been the unstated policy of the other major CBs for many years,
but now the BOJ has joined the party.
We've been long-term bearish on the
Yen since 1997 as it seemed obvious that the Japanese authorities would
eventually sacrifice their currency in a giant debt-monetisation splurge.
We may have just seen the initial phase of 'Yen trashing', with much more
to come (after a correction over the next couple of months).
The US
Stock Market
Getting There Fast
It is becoming clear that the stock
market is going to make a major bottom much sooner than we had originally
expected, most likely during the next 6-8 weeks. In other words, it looks
like we are very close to a bottom in terms of time, but are we close in
terms of price? As far as the NASDAQ Comp. and NASDAQ100 are concerned,
we'd say yes. As far as the Dow is concerned, we'd say no. The S&P500
falls somewhere in between.
The NASDAQ appears to be 'sold out',
which is not surprising considering how far it has fallen. Downside progress
has become laboured, and we continue to have a rather significant positive
divergence in that the Semiconductor Index (SOX) currently sits more than
10% above its November 2000 low. The SOX regularly makes 10% moves in a
day, so that divergence could disappear very quickly if the selling pressure
intensifies. However, with the market already as deeply oversold (by some
measures) as it was in the immediate aftermath of the 1987 crash, an intensification
of selling is highly improbable (outside of the 'old economy safe havens'
that have been propping up the Dow for the past few months).
In order to be confident that the market
is near a bottom in terms of price as well as time, we will need to see
the items listed in the latest WMU fall into place. Firstly, a sharp fall
in the Dollar and rise in the gold price would signal the capitulation
of foreign investors. We seriously doubt that a bottom can occur until
foreign investors, who are usually the last to arrive at the party and
the last to leave, have capitulated. As long as US$-denominated assets
are perceived as being the best place to park money, that is, as long as
confidence in the US$ remains at a relatively high level, we will not be
near THE bottom. Secondly, we would like to see substantial strength in
bond prices as evidence that the market has lost confidence in the Fed's
ability to inflate. During Wednesday's session long-term bond prices were
flat, despite yet another plunge in stock prices, suggesting that the market
still believes the Fed will eventually be successful (most likely after
one or two more rate cuts). Thirdly, a rally in the short-term that removes
the oversold condition and sets the market up for another fall would also
be helpful in getting us to THE bottom by early May.
Sentiment
In the latest WMU we mentioned that
the TSI Index of Bullish Sentiment, although being oversold almost continuously
for many months, had not indicated the sort of spike low in sentiment normally
associated with major bottoms. Based on preliminary readings for the past
week it looks like we are now getting that spike low. Also, the latest
results of the Consensus-inc Sentiment Survey show a bullish percentage
of 13. This is 4 points lower than the lowest reading that occurred at
the height of the 1998 financial crisis.
Current Market Situation
We've been anticipating a short-term
rally for some time, but none has materialised. The ability of this market
to continue its decline without so much as a pause to refresh is indicative
of a market in the throes of capitulation. A 1-2 week rally in stocks and
pullback in bonds would fit neatly into our forecast for a final plunge
in stocks and surge in bonds during April. Based on most of the technical
indicators we watch this should happen. However, the market does
not have to conform to any pre-defined pattern.
Bond Market
Update
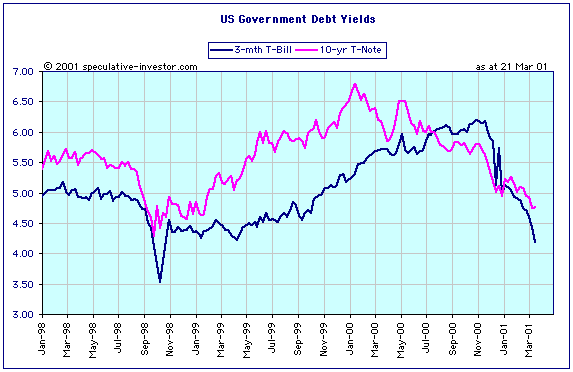
The similarities between the present
time and the 1998 financial crisis continue to build. Yields are falling
across the curve, with the yields on short-dated securities falling faster
than those on long-dated securities. As the following chart shows, short-term
yields were much higher than long-term yields (the yield curve was decisively
inverted) as recently as November last year, but the situation has completely
reversed since the beginning of this year.
One major difference between 1998 and
now that continues to stand out is the oil price - the oil price is MUCH
higher today than it was during the 1998 crisis. We cancelled our short-term
bullish view on oil at the end of last week and are currently sitting on
the fence, watching intently. A near-term rally in the oil price is still
possible and, although such an event would not dissuade the Fed from cutting
rates, it would highlight to the world something we already know: the current
liquidity injection is happening at a time when there is very little 'economic
slack' in the system (the supply of important resources is struggling to
match demand).
Gold and
the Dollar
Gold - what would make us bearish?
Most people who have a particular view
on the markets tend to latch onto any information that supports their view
and to find reasons to ignore/discard any information that supports an
opposing view. We almost always have a view on the markets, but try very
hard not to be married to that view. We have no interest in being bullish
or bearish, only in being right.
Where we run the greatest risk of letting
our views influence our interpretation of the facts, rather than letting
the facts influence our views, is the gold market. We have a natural bias
in favour of gold that stems from having some knowledge of monetary history
and the inherent flaws in the present monetary system. As such, we will
always find it difficult to be downright bearish on gold.
One thing that would make us long-term
bearish on gold would be a realisation that the US was headed into a prolonged
period of deflation. We see the probability of such an outcome as only
marginally greater than zero and our inflationist views are constantly
being solidified by the behaviour of the US monetary agents. However, if
something happened that altered our forecast from an inflationary to a
deflationary future we would become long-term bearish on gold. For those
who are new to our writings, deflation is a contraction in the total supply
of money. Falling prices are not deflation, although they can be
a result of deflation.
As far as the short-term is concerned,
the following would shake our confidence in a gold rally:
a) The Commercial traders becoming
net-short COMEX gold futures before the gold price had established
a solid up-trend.
b) The US$ failing to break lower
by the end of the first week in April
Current Market Situation
The next week will be a testing time.
Dollar strength will probably persist for a few more days, but we are approaching
the time when a reversal lower becomes likely. If the Dollar does remain
firm into next week then another quick sell-off in gold would not be a
surprise.
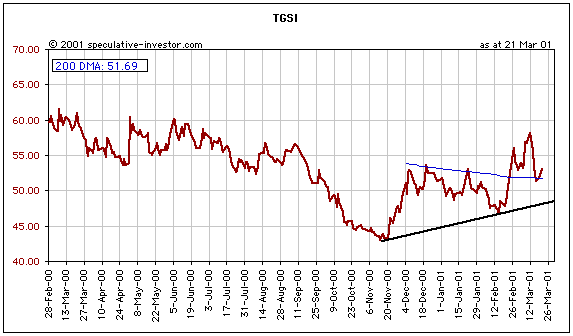
The XAU has failed to move back above
its 200-day moving-average, but not so the TSI Gold Stock Index (TGSI).
The below chart shows that the TGSI's 200 DMA essentially held during the
recent pullback. Both the TGSI and the XAU are in up-trends dating back
to last November.
Changes
to the TSI Portfolio
No changes.

|
