|
- Interim Update 21st May 2014
Copyright
Reminder
The commentaries that appear at TSI
may not be distributed, in full or in part, without our written permission.
In particular, please note that the posting of extracts from TSI commentaries
at other web sites or providing links to TSI commentaries at other web
sites (for example, at discussion boards) without our written permission
is prohibited.
We reserve the right to immediately
terminate the subscription of any TSI subscriber who distributes the TSI
commentaries without our written permission.
Bias
Do not blindly accept information as factual. Question
everything and either take into account the known bias of the person
presenting the information or at least be cognisant of the
possibility that the person presenting the information is promoting
an agenda.
It is often not possible to disprove a claim, which means that it is
often possible to concoct wild claims without fear of being proven
untruthful. For example, we could claim to have reliable inside
information that Barack Obama has secretly constructed a mosque in
the White House where he faces Mecca and prays to Allah every day.
Even though we would be lying, some people would be quick to believe
our story because it fits with their existing beliefs, and nobody
would be able to prove us wrong.
The above paragraph contains a hypothetical example to illustrate
our point. Here are some actual examples that we've recently come
across:
First, in our 19th May report we dealt with the claim that the Fed
had secretly purchased hundreds of billions of dollars of Treasury
securities via a Belgian entity. We can't prove that this claim is
wrong, just as we can't prove that there are no fairies at the
bottom of our garden. However, the claim is not supported by a
single shred of evidence and is nonsensical given the paper trail
that such a Fed action would inevitably leave. It's just a made-up
story that many people were quick to accept because it meshed with
their beliefs and biases. One of our beliefs is that the Federal
Reserve is the world's second-most dangerous and deceptive
organisation (second only to the US Federal government), but that
doesn't mean we believe every harebrained story about Fed covert
operations that does the rounds. The story has to at least make
sense and be supported by some evidence.
Second, the 17th May ZeroHedge piece posted
HERE reproduces the article at
http://www.vincelewis.net/unsoldcars.html about a massive
over-supply of new cars, evidenced, according to the article, by
photographs of hundreds of thousands of unsold new cars rotting in
outdoor storage areas around the world. As explained at
http://www.snopes.com/photos/automobiles/unsoldcars.asp, the
article is bogus. Why, then, did ZeroHedge present it as if it were
an accurate representation of the current situation? The answer is
that part of the ZeroHedge agenda is to promote the idea that the
global economy is rapidly 'going to hell in a handbasket'. This
doesn't mean that there isn't a lot of useful information to be
found at ZeroHedge; it means that to extract useful information from
the site you need the ability to filter out copious amounts of BS.
Third, the article posted
HERE makes use of a data-mining trick to promote the idea that
the broad stock market outperforms gold over the long term. We are
referring to the fact that by carefully selecting your start and end
points when doing long-term comparisons of different investments,
you can make the historical data show whatever you want it to show.
In the afore-linked article the trick involves choosing 1976, rather
than 1971, as the starting point. To be more specific, the article
states: "For the period 1928-2013, the average annual compound
real return of stocks = 6.3% and gold = 2.0%. However, the price of
gold was controlled by the government until the mid-70s when the US
finally abandoned the gold standard. For the period 1976-2013, the
average returns were stocks = 7.2% and gold = 2.0%." The problem
is that the government set the price of gold until 1971, not 1976,
and using 1971 as the starting point reduces the calculated
long-term performance of the stock market and greatly increases the
calculated long-term performance of the gold market. The 1976
starting point was either chosen out of ignorance or, more likely,
because if 1971 had been used then the historical record would not
show what the author of the article wanted it to show.
As an aside: Related to the third of our examples is the fact that
good past performance by an investment is often touted as a reason
to be bullish on that investment in the present, but the better the
past performance the worse the likely future performance. For
example, whereas in early-2000 many equity bulls and gold bears were
citing gold's miserable relative performance over the preceding two
decades as a reason to favour equities over gold in the present,
gold's terrible relative performance at that time all but guaranteed
that it would be a dramatic outperformer over the decade ahead. For
another example, whereas in 2011 many gold bulls were citing gold's
dramatic relative strength over the preceding decade as a reason to
favour gold in the present, the previous relative strength was a
reason to be cautious about gold's future prospects.
Fourth, the commentary put out by web sites that fixate on
gold-market manipulation will regularly cite cases where a sudden
increase in selling pressure in the futures market caused a quick
decline in the gold price. This is presented as evidence that the
gold price is being manipulated downward by nefarious forces. We
choose not to get involved in debates about ultra-short-term price
fluctuations because it is clear that these fluctuations have not
affected intermediate-term price trends. However, avid readers of
the manipulation-centric gold sites should be aware that sudden
spikes in BUYING pressure, leading to quick rises in the gold price,
also regularly occur. You, the reader, are just not told about them,
because telling you about them would detract from the agenda being
promoted. A recent post at
Kid Dynamite's World documents the sudden 'inexplicable' surges
in upside volume that occurred in the gold futures market between
early-April and early-May of this year.
In conclusion, don't automatically assume that the information you
are being fed is accurate or complete or being presented in a way
that creates a true impression. Be sceptical and keep in mind that
most commentators on economics and the financial markets have their
biases.
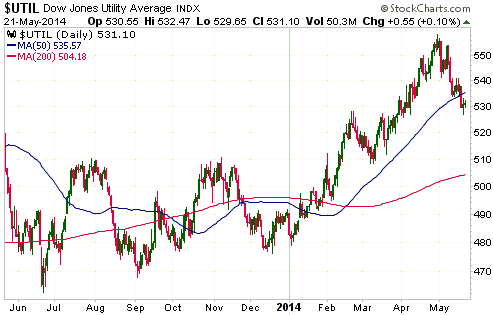
The Stock Market
The S&P500 Index (SPX) continues to meander along near its
all-time high, but, one by one, other US stock market indices are toppling over.
The latest casualty is the Dow Jones Utility Average.
In the 30th April Interim Update, we wrote:
"...the Dow Jones Utility Average (UTIL) has finally exceeded its 2007 peak.
However, it is very 'overbought' and is possibly tracing out a similar topping
pattern to the one that unfolded during 2007-2008. We are referring to the fact
that the UTIL made a high during Q2-2007 and then a marginally higher high in
Q4-2007 before rolling over into a major decline. This time around it made a
high in Q2-2013 and a marginally higher high in Q2-2014.
We certainly do not think that something akin to the 2008 crash lies in store
for the UTIL over the coming several months, but we do suspect that this year's
top is being put in place right now.
With the UTIL having recently 'gone parabolic', a daily close below the 50-day
MA would now be a reliable signal that a top of at least intermediate-term
importance was in place."
The following chart shows that the UTIL closed below its 50-day MA on Monday of
this week, so we now have a reliable signal that a top of at least
intermediate-term importance is in place for this index.
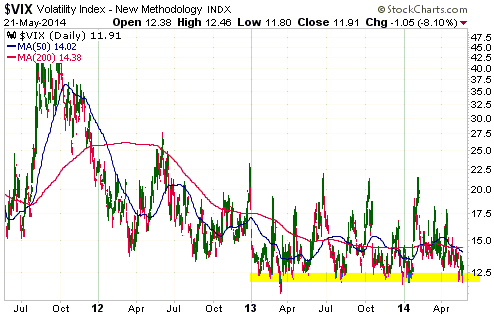
With the S&P500 Index appearing to be in a somnambulant state it is not
surprising that the Volatility Index (VIX) has dropped back to near its low of
the past few years. Even during on-going bull markets, periods of unusually low
volatility are almost always followed by volatility surges caused by the
majority of market participants being taken unawares by a sizeable price
decline.
Gold and the Dollar
Gold
It's hard to imagine how the gold market's price action could be any less
exciting than it has been over the past few weeks. Note, though, that dull price
action has recently been a characteristic of most of the major financial
markets, including the currency and US stock markets. In other words, the gold
market's aimless drifting is consistent with a general financial-market
environment that could aptly be described as comatose. As we said last week in
our discussion of the gold-mining sector, this is the proverbial calm before the
storm.
As illustrated below, the gold market's trading range is small and getting
smaller. Something is soon going to give. We continue to believe that the next
tradable ($100+) move will be to the upside, but we cannot rule out the
possibility that there will be a quick downward spike -- say, to around $1250 --
prior to the start of a meaningful rally. Just to be clear: we do not expect a
downward spike to the $1250s, but we would be remiss not to mention the
possibility.

Gold Stocks
The HUI is staggering along near its lows of the past two months, frustrating
the bulls by not showing any sign of strength and frustrating the bears by not
accelerating downward. Beneath the surface, however, there is evidence that the
downward correction of the past two months is about to end. We are referring to
the fact that a bullish divergence has developed between the HUI and the GDXJ/GDX
ratio (junior gold stocks relative to senior gold stocks).
The following chart shows the aforementioned bullish divergence as well as the
bearish divergence that formed during February-March and the bullish divergence
that formed in December. In this case, a bullish divergence involves lower lows
in the HUI in parallel with higher lows in GDXJ/GDX, while a bearish divergence
involves higher highs in the HUI in parallel with lower highs in GDXJ/GDX.
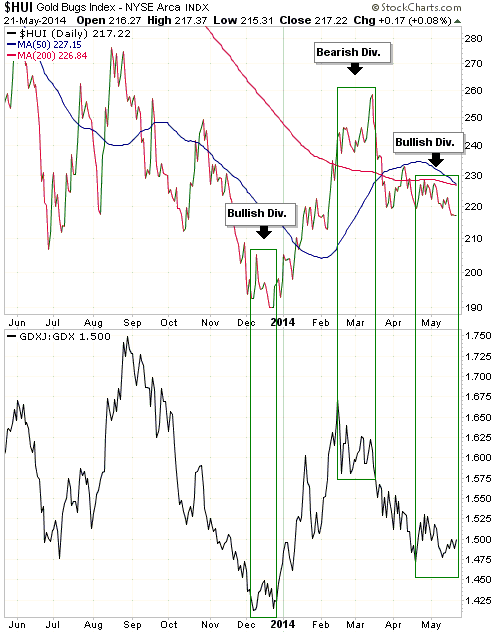
Even if the gold-mining sector is about to begin a new short-term upward trend
(we think it is), a 'cleansing' spike down to 210 could precede a sustainable
upturn.
Currency Market Update
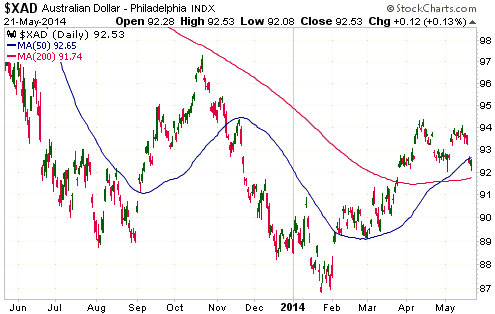
The A$ commenced a correction during the first half of April. Based on the
lead-lag relationship of the past 18 months between gold and the A$, the next
short-term upward trend in the A$ is likely to start about one month after the
start of the next short-term upward trend in the gold market. This suggests to
us that the A$ will remain in correction/consolidation mode until at least the
second half of June, although we suspect that the ultimate correction low won't
be far from this week's low.
Updates
on Stock Selections
Notes: 1) To review the complete list of current TSI stock selections, logon at
http://www.speculative-investor.com/new/market_logon.asp
and then click on "Stock Selections" in the menu. When at the Stock
Selections page, click on a stock's symbol to bring-up an archive of
our comments on the stock in question. 2) The Small Stock Watch List is
located at http://www.speculative-investor.com/new/smallstockwatch.html
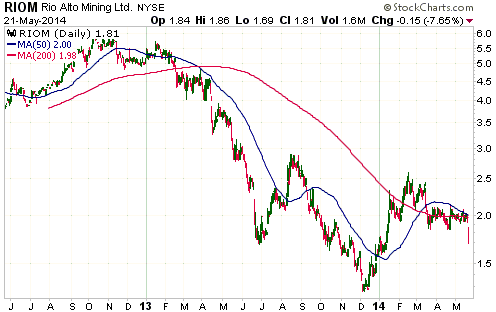
 Rio
Alto Mining (RIOM, RIO.TO) is buying Sulliden Gold (SUE.TO) Rio
Alto Mining (RIOM, RIO.TO) is buying Sulliden Gold (SUE.TO)
There are two Rio Alto positions in the TSI Stocks List -- a trading position
under the Canadian symbol (RIO.TO) and a long-term position under the US symbol
(RIOM). Due to the news announced prior to the start of trading on Wednesday
21st May, we are immediately exiting both positions. At Wednesday's closing
price of US$1.81/C$1.96, it was a roughly break-even result in both cases.
Here's why we are taking this action:
Depending on the price paid, almost any asset is capable of being a good
investment or a bad investment. For example, a high-enough price could turn the
best asset in the world into a bad investment. In a nutshell, the reason we no
longer believe that RIOM's risk/reward warrants its inclusion in the TSI List is
that the company has, in our opinion, just agreed to pay an extremely high price
for a development-stage gold project (the Shahuindo project in Peru). Regardless
of the synergies created by the acquisition and the potential of the asset being
acquired, the price being paid is so high that it substantially reduces RIOM's
per-share value and, to add insult to injury, increases the risk.
There are good reasons to combine RIO and SUE. Of particular relevance, SUE's
Shahuindo project has a similar oxide gold deposit to RIO's La Arena project,
enabling Shahuindo to eventually be mined using the same methods that have been
used very successfully at La Arena, and the two projects are only 30kms apart.
Consequently, the combination would definitely make sense at the right price.
The problem is that a September-2012 FS for the Shahuindo project suggests that
SUE was a relatively expensive stock at its pre-bid price of C$0.78 (the FS
estimated that Shahuindo could be developed into a 90K-oz/year gold mine with an
after-tax IRR of 33% at a gold price of $1300/oz). At the same time, RIO's cost
and production profile indicated that it was very under-valued at its pre-bid
price. Based on relative valuation it would therefore have made sense if the
merging of the two companies had involved SUE paying a hefty premium for RIO,
rather than the other way around. As it is, RIO is trading almost half the
company for a speculative asset that is still about 2 years from production --
assuming that the development of the asset is not curtailed by political or
local-community opposition (not necessarily a valid assumption). According to
our calculations, RIO is over-paying by at least 200% for this asset.
The stock market obviously places a much higher valuation on SUE's Shahuindo
project than we do. That's why SUE was being valued at almost C$250M prior to
the announcement of RIO's bid and why RIO's stock price 'only' closed down by
about 8% on Wednesday. This suggests that RIO will still perform well during the
next multi-month rally in the gold sector, but we no longer have confidence that
it will out-perform and we are concerned that it is now a riskier proposition.
By way of full disclosure, we went into Wednesday's trading session with a large
position in RIOM. We sold 20% of our shares at US$1.82, which means that we
still have a larger-than-average position in the stock. Our plan is to gradually
scale out over the next two months.
One reason that we have no intention of immediately selling more RIOM shares is
that we do not want to significantly reduce our exposure to the gold-mining
sector at this time. Another reason is that we haven't identified a suitable
replacement. Note, though, that if we didn't already have full positions in
EDV.TO and EVN.AX we would sell more RIOM shares and use the proceeds to buy the
shares of these other gold producers.
We may return RIOM to the TSI List in the future, either as a short-term trade
in response to price action or as a long-term position if the SUE takeover is
not approved by RIOM shareholders or if it turns out that we have greatly
under-estimated the value of the Shahuindo project. Given that RIOM's management
has a lot more information about Shahuindo than we do, it is certainly possible
that we are currently under-estimating this project's value.
Geomega Resources (GMA.V) is not a formal TSI stock selection
and is unlikely to become one in the near future, but it is part of
the TSI Small Stocks Watch List and we are therefore loosely
tracking it at TSI.
GMA's upside potential stems from the huge rare-earth-elements (REE)
deposit at its Montviel project in Quebec and new REE separation
technology being tested by the company that could dramatically
enhance the project's economic viability. A new set of results from
the on-going testing of the separation technology were released last
week.
The latest results, like earlier results, appear to be positive, but
for some reason unknown to us the stock market's reaction was
negative. The stock price dropped from the C$0.60s to C$0.40 in the
aftermath of the news.
GMA's stock price has been extremely volatile since the beginning of
this year, having traded as low as C$0.10 and as high as C$1.06. The
moonshot during the first 2 months of the year was due to the
excitement caused by the initial test results of the REE separation
technology.
Owning GMA shares is a good way to have some long-term exposure to
REE prices, and the market reaction to the latest news has created a
new buying opportunity. However, buying should be done on a small
scale due to the high risk and volatility of the stock.
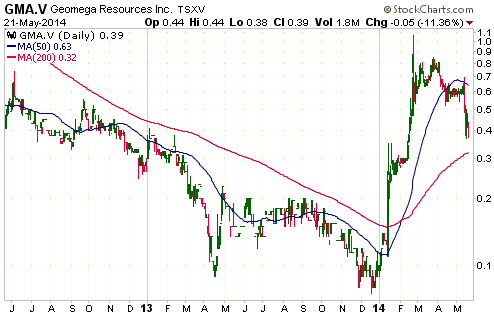
Chart Sources
Charts appearing in today's commentary
are courtesy of:
http://stockcharts.com/index.html

|
