![]()
![]()
![]()
![]()
- Interim Update 21st June 2017
Copyright
Reminder
The commentaries that appear at TSI
may not be distributed, in full or in part, without our written permission.
In particular, please note that the posting of extracts from TSI commentaries
at other web sites or providing links to TSI commentaries at other web
sites (for example, at discussion boards) without our written permission
is prohibited.
We reserve the right to immediately
terminate the subscription of any TSI subscriber who distributes the TSI
commentaries without our written permission.
Commodities
The Fundamentals
For most industrial commodities the term structure of the futures
market (the price differences between the nearer and the more distant
delivery months) is by far the most accurate and useful indicator of the
physical supply-demand situation. This is because the term structure takes
into account everything that is known about current supply/demand as well
as the market's expectations regarding future supply/demand. For example,
the reported inventory levels that some analysts fixate on are tracked by
every commercial trader and most speculators, meaning that inventory
levels will always be factored into the current term structure along with
all other known information about supply and demand.
The following
charts show the current term structures for two of the industrial
commodities that we are interested in. The first chart deals with oil and
is based on NYMEX futures prices for West Texas Intermediate Crude. The
second chart deals with copper and is based on COMEX futures prices*.
Both charts contain lines with gentle upward slopes, indicating that
the later the delivery month the higher the price. This reflects a normal
supply-demand situation for these markets. It suggests that the markets
are adequately supplied at this time and that the average trader expects
them to remain so in the short-term. It also suggests that neither market
is experiencing a supply glut, in that the lines would be more steeply
sloped if that were the case.
*Note that a more accurate view of copper's
term structure would use LME prices, but we don't have ready access to the
LME data.
The Price Action
Spurred
along by the idea that Trump's election victory would soon herald a faster
pace of economic activity, the basket of 24 commodity prices represented
by the S&P Spot Commodity Index (GNX) enjoyed a post-election surge. The
idea of what a Trump presidency would entail subsequently collided with
reality and the GNX has now given back all of its post-election gains.
The GNX will probably fall further before it reaches a sustainable
low, but it is 'oversold' and should soon commence a counter-trend
rebound.
The above chart of the GNX looks very similar to the following chart
of the oil price. It is therefore clear that even though the GNX basket
contains 24 commodities, the performance of a single commodity (oil) has a
strong influence on the performance of the index. This is undoubtedly
because the index is production-weighted.
Although we have been
unrelentingly-bearish on oil over the past several months, during the
first three days of this week the oil price managed to surprise us on the
downside. We continue to expect that oil will trade in the $30s ($35 is a
realistic objective) before reaching an intermediate-term bottom, but we
didn't expect the May low to be breached as soon as this week.
Like
the GNX, the oil price is short-term 'oversold' and will probably soon
rebound.

Stepping back to view the big picture, commodities are now extremely
cheap relative to the S&P500 Index (SPX). This is evidenced by the
following weekly chart, which shows that GNX is now at its lowest level
relative to the broad US stock market since 2000.
The GNX could get
even cheaper relative to the SPX prior to a reversal, but the stage is
being set for a major mean-reversion.
The Stock Market
The US
The NASDAQ100 Index (NDX) hasn't yet signaled a reversal of its short-term
trend. However, despite the SPX breaking out to a new high earlier this
week the NDX has only managed to retrace about half of the decline from
its early-June peak. This is interesting.
If a reversal is soon
signaled then our short-term downside target will be the lateral support
at 4900. In effect, what we have in mind is that the NDX's post-election
rally will be fully retraced, thus bringing this index into line with the
many other markets that have already retraced their post-election up-moves
or are close to doing so.
The risk/reward for a short-term US-stock-market bearish speculation
is now almost as good as it gets. This is not just because the potential
downside is significant but also because the risk-management parameters
are clear enough to enable any loss on the trade to be kept to a modest
level. Specifically, if this really is a good time to be making a
short-term bet against the US stock market then the NDX should not confirm
the SPX's new high by closing above its early-June peak. This means that a
stop could logically be set within 2.5% of Wednesday's close.
Further to the above, we have added a QID trading position to the TSI List
at Wednesday's closing price of US$16.68. QID, a daily chart of which is
displayed below, is an ETF that is designed to move in the opposite
direction to the NDX at twice the pace.
If all goes to plan then
the trade will be exited at a profit when the NDX drops below 5000 at some
point over the next six weeks. If not, it will be exited at a small loss
when the NDX closes above 5910.

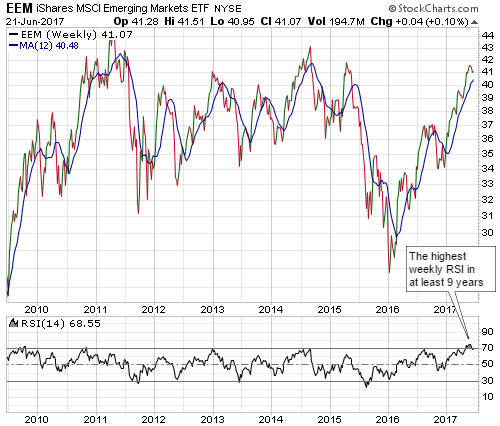
The Emerging Markets Equity ETF (EEM)
The
following weekly chart shows that EEM's weekly RSI recently hit its
highest level in many years. This doesn't necessarily mean that a
substantial decline is about to begin, but it does suggest that the
proverbial rubber-band is stretched very tightly.
After a market
reaches an upward momentum extreme (as indicated by the RSI) it will often
pull back and then make a higher price high in parallel with a lower
momentum high before commencing a substantial decline. It's therefore
possible that even if EEM's next big move is destined to be to the
downside it could rise to test long-term lateral resistance near $43
before commencing such a move.
Based on EEM's past performance, a
weekly close below the 12-week MA (the blue line on the following chart)
could provide a timely warning that a substantial decline has begun.
Gold and the Dollar
Gold
In
the latest Weekly Update we wrote: "The double top at $1300 suggests
downside potential to the mid-$1100s, but with respect to the next couple
of weeks we doubt that gold will do worse than test support near its
early-May low (around $1220)."
Gold was at $1256 at the time
and has since traded as low as $1241, meaning that it got to within
$20-$25 of the short-term support mentioned above. It could still test the
area near $1220 before rebounding, but the decline is becoming laboured
and the gold-mining sector is beginning to show some resilience. Also
worth pointing out is that the 200-day MA offers some support in the
low-$1240s. It therefore won't surprise us if a rebound soon begins.
A routine counter-trend rebound would take the gold price up to
$1260-$1270.
Silver
The silver price has closed lower on 10
of the past 11 trading days. Silver is therefore 'oversold', although not
as 'oversold' as it was at the early-May low.
A routine
counter-trend rebound that began from near the current level would take
the price up to around $17.00. A decline to a new 12-month low would then
likely begin.
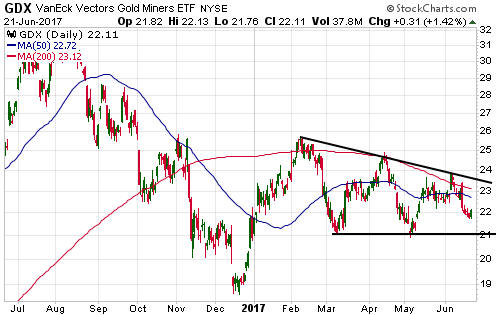
Gold Stocks
The Gold Miners ETF (GDX) was
roughly unchanged over the first three days of this week. Consequently, it
is still in the middle of its contracting range.
To signal the
start of the next tradable move GDX will have to either close below
support at $21.00 or close above its early-June high of $23.86. It is more
likely to do the former than the latter, but we'll take the evidence as it
comes.
In the meantime, GDX's flat performance over the first three
days of this week was slightly bullish given that it happened in parallel
with a $10 decline in the bullion price. It may therefore be time for a
minor rebound.
The Currency Market
The Dollar Index (DX) has
now spent a month chopping around in a 1-point range near its low for the
year. As previously advised, a daily close above 97.5 would signal the
completion of a basing pattern and the start of a potentially significant
rally.
With the DX essentially doing nothing and the currency
market generally quiet we'll take the opportunity to revisit the
relationship between the US$ gold price and the Yen. As we've mentioned
many times in the past, the Yen is the currency most strongly correlated
with the gold price. The correlation is clearly evident on the following
daily chart.
Seemingly minor divergences or non-confirmations
between gold and the Yen sometimes occur at important turning points. In
other words, divergences or non-confirmations between gold and the Yen
that seem minor in real time can turn out to be important.
A
potentially important non-confirmation occurred in early-June when the US$
gold price closed marginally above its April high and the Yen failed to
reach its April high. This non-confirmation has bearish short-term
implications for both the gold price and the Yen.
Updates on Stock Selections
Notes: 1) To review the complete list of current TSI stock selections, logon at
http://www.speculative-investor.com/new/market_logon.asp
and then click on "Stock Selections" in the menu. When at the Stock
Selections page, click on a stock's symbol to bring-up an archive of
our comments on the stock in question. 2) The Small Stock Watch List is
located at http://www.speculative-investor.com/new/smallstockwatch.html
Chart Sources
Charts appearing in today's commentary
are courtesy of:
http://stockcharts.com/index.html
![]()