|
- Interim Update 21st July 2004
Copyright
Reminder
The commentaries that appear at TSI
may not be distributed, in full or in part, without our written permission.
In particular, please note that the posting of extracts from TSI commentaries
at other web sites or providing links to TSI commentaries at other web
sites (for example, at discussion boards) without our written permission
is prohibited.
We reserve the right to immediately
terminate the subscription of any TSI subscriber who distributes the TSI
commentaries without our written permission.
Responses to e-mails
We like to receive your
comments/questions via e-mail because they give us ideas on topics to
discuss in the commentaries, and we can assure you that we read all
incoming mail. However and as previously mentioned, time constraints
and the large volume of e-mail that we receive these days prevents us
from responding to most market and stock-related questions. So, keep
the e-mails coming but please don't be offended if you don't receive a
response.
'Greenspeak'
Alan Greenspan gave his semiannual monetary policy testimony before Congress on Tuesday (http://www.federalreserve.gov/BoardDocs/HH/2004/July/testimony.htm)
and, as is his practice, he totally ignored the role played by Federal
Reserve monetary policy in both the financial market instability of the
past several years and the current problems/risks facing the US
economy. Anyone gullible enough to accept Greenspan's analysis at face
value would be left with the impression that the collapse in stock
prices and corporate profits during 2000-2002, the 20% decline in the
US$ during 2002-2004, and the surge in commodity prices during
2003-2004, were all just unforeseeable and unrelated accidents. Such a
person would also probably conclude that the Fed, via its
ultra-accommodative monetary policy, had been able to ameliorate most
of the bad effects resulting from these unfortunate accidents whilst
achieving its noble goal of "price stability". Nowhere in this latest
testimony, or, for that matter, in any other official testimony/report
that we know of, does Greenspan acknowledge the Fed's key role in
fostering the enormous growth in the supply of money/credit that has
wrought havoc in the financial markets since 1998 and continues to pose
a huge threat to the world.
The avoidance of appearing to be responsible for the huge US credit
bubble and its consequences has clearly been a major goal of the
Greenspan-led Fed over the past 3 years. Events such as the 9/11
attacks, the Iraq war and the many corporate scandals (Enron, Worldcom,
etc.) were therefore seized upon as excuses for many of the problems
that would more appropriately have been linked to reckless monetary
policy.
Perhaps the most convenient and effective of all the excuses, though,
was the "deflation threat". And in his on-going efforts to re-write
history Greenspan, in this week's remarks before Congress, read the
epitaph of the deflation threat as though it had ever existed in the
first place. What he said was "...the
concerns about the remote possibility of deflation that had been
critical in the deliberations of the Federal Open Market Committee
(FOMC) last year can now be safely set aside. Those deflationary
pressures were largely a consequence of the stock market slump, the
capital goods contraction that commenced in 2000, and, as I noted
earlier, the extreme business caution that followed from these events
as well as from terrorist attacks, corporate scandals, and the lead-up
to the war in Iraq."
When deflation threats do exist they are never a consequence of stock
market slumps or any of the other things cited by the Fed-head in the
above paragraph, but are, instead, a consequence of a preceding
inflation. The main point, though, is that a genuine deflation threat
didn't exist last year or the year before. In fact, ever since the
Federal Reserve system was put in place in 1913 there's been a
continual process of inflation with the only interruption occurring
during the early-1930s; and that interruption only happened because the
Fed's hands were effectively tied due to the dollar being convertible
into gold at a fixed rate. Had the current monetary system been in
effect during the 1930s we doubt that there would have been any
deflation at that time, either.
The fact that the Fed has been able to inflate almost non-stop for 90
years and yet smart people are still willing to seriously consider the
possibility of deflation at the drop of a hat (or a price) is testament
to the wonderful job that the Fed has done, and continues to do, in the
field of expectations management. From the Fed's perspective, last
year's deflation scare served a useful purpose by providing a cover for
more inflation; and there will almost certainly be more deflation
scares over the years ahead in order to create the illusion that still
more inflation is needed.
The US
Stock Market
Current Market Situation
According to the mainstream financial press, when the market bounced on
Tuesday it was due to Greenspan's positive comments on inflation and
growth combined with Microsoft's decision to return $75B to
shareholders. And then when the market fell sharply on Wednesday the
fall was attributed, in the press, to fears about slowing growth in
corporate profits. So let's get this straight; we are supposed to
believe that professional traders and investors bought stocks across
the board on Tuesday simply because a) Greenspan, a man whose
forecasting record is almost completely unblemished by success, opined
that the growth outlook was positive, and b) one company announced some
positive news. And then we are supposed to believe that the very next
day professional traders and investors promptly forgot why they had
bought stocks on Tuesday because they suddenly realised that growth was
actually slowing.
A lot of the daily fluctuations in stock prices are random and it often
makes no sense to attempt to explain why stocks did what they did on
any given day. And even when there is a good explanation for the market
action on a particular day that explanation is generally not the 'news
of the day' to which the press tends to link to the market's behaviour.
As far as this week's back and forth action is concerned we think there are two explanations that make some sense.
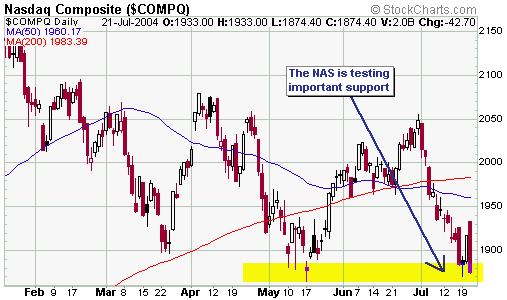
First, the small picture is that some of the senior stock indices began
Tuesday's session having just tested important support levels the day
before, so it was a logical time for traders to enter the fray on the
long side and for short-sellers to cover some of their positions. For
example, the below chart shows that the NASDAQ Composite Index tested
its May low on Monday and was therefore in a good position to bounce on
Tuesday.

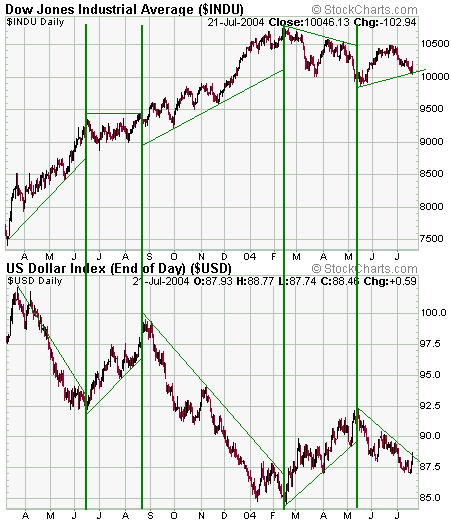
Second, the bigger
picture is that US$ strength has gone with stock market weakness over
the past 15 months and the dollar has just begun to show signs of
strength. For example, the below chart indicates that the recovery in
the Dow Industrials Index from its May low went with dollar weakness
while the preceding decline went with dollar strength, so if the dollar
has just bottomed then the rebound in the stock market is probably
kaput. Now, we expect that there will be a bit more downside in the
dollar over the next few weeks, but yesterday's action demonstrates
that the inter-market relationships that have been in force over the
past 1-2 years are intact and that a resumption of the dollar's
post-February recovery would be a big problem for the US stock market.

Over the past few
months all breakouts -- those of both the upside and downside varieties
-- have been quickly followed by reversals. A breakout is eventually
going to stick, but if the stock market is true to its recent form then
a break below the May lows will be quickly followed by a significant
bounce. In fact, traders have been conditioned by the market's
performance over the past few months to expect breakout failures, so
there's a good chance that if a break below the May lows does occur
over the coming days then it will be followed by a rebound. In all
likelihood such a rebound would, though, just be a 'pause to refresh'
within a continuing short-term downtrend.
Our view is that the stock market is going to head lower into a
traditional September-October bottom, but a 1-2 week intervening
rebound would not be surprising following a downside breakout.
Gold and
the Dollar
Gold Stock Seasonality
In the 22nd September 2003 Weekly Market Update we discussed the strong
tendency of gold stocks to reach an extreme during the October-November
period. The time has come to re-visit this topic.
As shown in the below table, gold stocks have made either an important
low or an important high during October-November in 9 of the past 12
years with 3 of the 4 highs occurring in October and 4 of the 5 lows
occurring in November.
|
Year
|
Extreme (High or Low)
|
|
Oct-Nov 2003
|
High (Nov)*
|
|
Oct-Nov 2002
|
Low (Oct)
|
|
Oct-Nov 2001
|
Low (Nov)
|
|
Oct-Nov 2000
|
Low (Nov)
|
|
Oct-Nov 1999
|
High (Oct)
|
|
Oct-Nov 1998
|
High (Oct)
|
|
Oct-Nov 1997
|
High (Oct)
|
|
Oct-Nov 1996
|
-
|
|
Oct-Nov 1995
|
Low (Nov)
|
|
Oct-Nov 1994
|
-
|
|
Oct-Nov 1993
|
-
|
|
Oct-Nov 1992
|
Low (Nov)
|
*In 2003 the actual closing high for the XAU occurred on the second trading day of December
The above-described gold stock seasonality suggests that the
October-November period this year will provide us with either a major
peak or a major trough. But which will it be?
If our intermediate-term dollar view is in the right ballpark then the
most likely outcome would be a low. Also, the idea that we will get an
October-November trough this year meshes with our views that a) the May
low in the gold sector will have to be tested before the next major
upward leg gets underway, and b) there will be substantial stock-market
weakness over the coming few months (gold stocks seldom do well when
the broad stock market is moving lower at a brisk pace).
Taking the seasonality one step further, gold-stock lows have tended to
occur in November whereas highs have tended to occur in October.
Furthermore, unlike last year when many seasonal patterns were
reversed, this year is shaping up to be a more normal one as far as
seasonality is concerned. Therefore, we think that November is the most
likely candidate for a gold-stock bottom.
An argument to the effect that gold stocks will be trading lower in 3-4
months time than they are right now would probably not be music to the
ears of most investors in this sector, but in one important respect it
should be. This is because if the seasonal tendencies hold this year
then a drop into the October-November timeframe would have very bullish
implications for the ensuing 12 months. On the other hand, a surge into
this timeframe would likely create a secondary peak and usher in a 6-12
month downward trend.
Current Market Situation
Gold and Gold Stocks
For the past 2 months our short-term upside targets have been $415 for
gold and 205-215 for the AMEX Gold BUGS Index (HUI). At the same time,
our intermediate-term view has been that tests of the May lows were
likely to occur later this year. In other words, we've been expecting
rallies up to near the aforementioned targets followed by pullbacks to
the May lows.
This week's action, however, suggests that the markets have turned
lower without first achieving our short-term goals. For example, the
below charts of gold, the HUI and Newmont Mining (NEM) show that:
a) Gold has fallen back below its 18-day MA, its 200-day MA, and important support at $400
b) The HUI has dropped below its short-term trend-line and has broken a
sequence of rising bottoms by closing marginally below its late-June
low on Wednesday
c) NEM, which had broken out to the upside early this month, dropped back below its breakout level on Wednesday
The above-described
technical evidence is not definitive, but it does suggest that rebound
peaks are already in place for gold and gold stocks. If this proved to
be the case it would be disappointing, but wouldn't have any
significant effect on our intermediate- or long-term outlooks. The one
effect it potentially would have is that a downward reversal in the HUI
prior to a move above the former breakdown level (208) would increase
the probability that we are going to get a spike below the May low
before the next major advance gets underway.
In the coming Weekly Update we'll devote some more space to the SA gold
shares because the impending low for the US$ will potentially result in
these stocks displaying substantial relative strength.
The Dollar
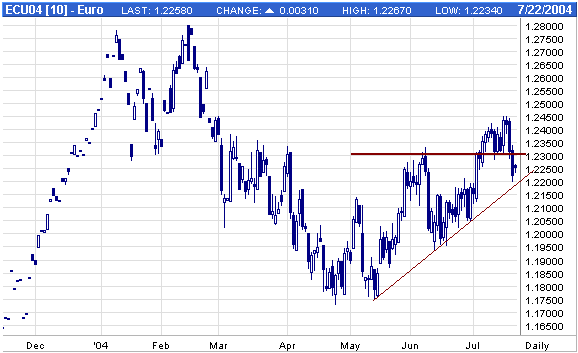
There are some signs that a bottom for the dollar is already in place.
For example, the below chart shows that September euro futures closed
below important support on Wednesday.

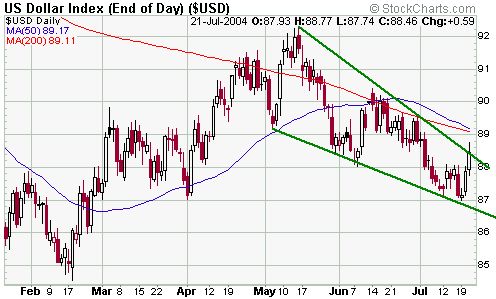
The Dollar Index has
not yet, however, displayed enough strength to convince us that the low
is 'in'. In particular, it remains below its 50-day MA and yesterday's
rebound halted at the short-term trend-line shown on the below chart. A
daily close above yesterday's high would be needed to swing the odds in
favour of a low being in place.

At this stage we
think the odds favour some more downside in the dollar over the coming
2-3 weeks, but the recent action in the gold market is consistent with
the dollar being close to a low in terms of both time and price. Also,
given that our short-term downside target for the Dollar Index is 83-86
while our intermediate-term upside target is 100 we certainly perceive
more upside risk than downside risk in the dollar as far as the coming
6 months are concerned.
Hedging your gold stock exposure
We are generally not in favour of using put options to hedge exposure
to the stock market, for two reasons. First, if we use our favoured
approach of scaling into the market during extreme weakness and scaling
out of the market during extreme strength then we should end up having
substantial cash reserves during the declines, meaning that we should
not need the insurance provided by put options. And in general -- not
just in the financial markets but in all aspects of life -- you
shouldn't pay someone else to assume a risk that you can comfortably
assume yourself. Second, put options are a very expensive form of
insurance.
Right now, though, we are in a situation where the likely time window
for a decline in the gold sector is quite narrow (3-4 months), so while
buying put options would not be a good substitute for having a
substantial cash reserve if you were ever going to buy put options for
insurance purposes then now would be a reasonable time to do so.
It is not possible to buy put options on the majority of gold stocks
and for gold stocks where options are available they are often so
illiquid they are difficult to trade. However, Newmont Mining (NEM)
almost always moves with the gold sector so buying NEM December puts --
preferably during strength in the NEM stock price over the coming 1-2
weeks -- would be one way to hedge a diversified gold stock portfolio.
Update
on Stock Selections
 A
couple of weeks ago we added some Phelps Dodge (PD) put options to the
TSI Stocks List to reflect our view that stock and commodity prices
would likely be weak over the ensuing few months. The PD stock price
has dutifully dropped quite sharply over the past three days (see chart
below), but no significant technical damage has yet been done. For
example, yesterday's decline halted right at short-term trend-line
support. The $70-$71 area should also provide some support if/when it
is reached. A
couple of weeks ago we added some Phelps Dodge (PD) put options to the
TSI Stocks List to reflect our view that stock and commodity prices
would likely be weak over the ensuing few months. The PD stock price
has dutifully dropped quite sharply over the past three days (see chart
below), but no significant technical damage has yet been done. For
example, yesterday's decline halted right at short-term trend-line
support. The $70-$71 area should also provide some support if/when it
is reached.
If we get the sort of
weakness we are expecting in the stock market over the next few months
combined with some weakness in the copper price then PD should, at a
minimum, drop back to test its May low.
Chart Sources
Charts appearing in today's commentary
are courtesy of:
http://stockcharts.com/index.html
http://www.futuresource.com/

|

