![]()
![]()
![]()
![]()
- Interim Update 21st October 2015
Copyright
Reminder
The commentaries that appear at TSI
may not be distributed, in full or in part, without our written permission.
In particular, please note that the posting of extracts from TSI commentaries
at other web sites or providing links to TSI commentaries at other web
sites (for example, at discussion boards) without our written permission
is prohibited.
We reserve the right to immediately
terminate the subscription of any TSI subscriber who distributes the TSI
commentaries without our written permission.
The SEC drives
Money-Market Funds (MMFs) into Treasury debt and other investors into gold
As
explained by giant US fund manager Fidelity last week, in July-2014 the U.S.
Securities and Exchange Commission (SEC) issued new rules for the further
regulation of MMFs that are to be implemented by October-2016. Under the new SEC
rules, non-government MMFs may impose a redemption fee or temporarily halt
redemptions if fund liquidity falls below certain limits. However, MMFs that
hold only government and agency (Fannie and Freddie) debt securities will not be
affected by the new rules. Therefore, some Fidelity MMFs that previously
invested in senior corporate loans and secured debt securities are transitioning
to government funds. The transition is expected to be complete by December of
this year.
Fidelity is not the only fund manager that is responding to the coming new rules
by changing the holdings of some MMFs from non-government to government
securities. It is currently expected that around $1T of assets will be affected.
In other words, the new rules are expected to boost the demand for short-dated
US Treasury/Agency securities to the tune of about 1 trillion dollars and reduce
the demand for short-dated corporate debt by the same amount.
We doubt that this was a deliberate ploy to underpin the Treasury market,
because the demand for Treasury securities was/is already abundant. It's more
likely that a shift of this magnitude from corporate to government debt is an
unintended consequence of the new rules.
Intentional or not, a likely effect will be a steeper US yield curve over the
coming 12 months. The reason is that the rule changes will put additional
downward pressure on interest rates at the short end but probably won't affect
interest rates at the long end, causing long-term interest rates to rise
relative to short-term interest rates. This means that the rule changes are
likely to make the interest-rate backdrop more bullish for gold.
The Stock Market
The US
The SKEW Index gets 15 minutes of fame
The SKEW Index, which is calculated from out-of-the-money S&P500 put options,
rises to higher levels as investors become more fearful that there will be a
"black swan" event such as a stock market crash in the near future (a rising
SKEW reflects an increasing desire to hedge against extreme downside over the
coming 30 days). It has been published by the CBOE for more than 4 years, but
until the past month we had never seen it mentioned anywhere. Over the past
month, however, we've seen it mentioned in articles from several different
sources. SKEW is suddenly popular! But is it useful?
The answer is no. SKEW values have been all over the place and have not
consistently predicted anything in the past. For example, in August of this year
the SKEW rose as the stock market fell sharply, but there was no anticipation of
the market decline in the performance of SKEW (the rise in the SKEW was a
reaction to the price decline). Furthermore, there have been many times when
SKEW rose sharply and the market subsequently did very little.
SKEW is also not useful as a contrary indicator, because sometimes it does rise
just prior to significant declines.
As far as we can tell, its values are almost random.
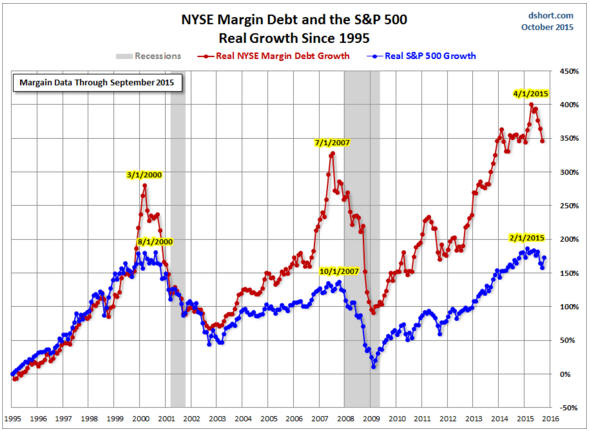
NYSE Margin Debt points to a bear market
Regardless of how far into 'nosebleed territory' it moves, leverage in general
and margin debt in particular is bullish for asset prices as long as it
continues to increase. It's only after market participants begin to scale-back
their collective leverage that asset prices come under pressure. That's why the
pronounced downturn in NYSE Margin Debt from its April-2015 all-time high should
be taken as a warning that a US equity bear market got underway in July.
The reversal in NYSE Margin Debt from its April-2015 high is illustrated by the
following chart from Doug
Short. Notice the similarity of this year's Margin-Debt reversal to the
reversals that occurred in early-2000 and mid-2007.
Due to the stock-market rebound, Margin Debt will probably increase in October.
If so, a subsequent decline to below the September low would be the final nail
in the bull market's coffin.
As things currently stand, a resumption of the trend towards greater leverage
cannot be ruled out. It just appears to be very unlikely.
Current Market Situation
We doubt that the S&P500 Index (SPX) will breach or seriously challenge its 24th
August low over the remainder of this year, but a tradable decline will probably
soon begin. It could therefore soon be appropriate for short-term traders to
establish bearish positions.
A rise by the SPX to the 2050s would make the short-term risk/reward
sufficiently bearish to warrant a bearish speculation. However, in the latest
Weekly Update we noted that a better -- because it would allow for tighter risk
management -- entry point would be provided by a multi-day pullback followed by
a rise to a slightly lower high. A third approach would simply be to start
averaging into a bearish speculation immediately with the initial
risk-management plan of exiting if the SPX makes a new multi-month high after
early-November.
To give you a rough idea of what we are expecting to happen over the weeks
ahead, we'll return to the 2011 Model. We've been using the H2-2011 price action
as a guideline for what to expect this year, and although we do not think that
2016 will be similar to 2012 we will continue to use 2011 as a model as long as
it continues to work.
The first of the following charts shows the SPX during 2011 and the second of
the following charts shows the SPX since the beginning of this year. The
similarities are obvious. If the SPX now does exactly what it did at the same
stage in 2011 it will rise sharply to the vicinity of its 200-day MA over the
coming few days before embarking on a decline that quickly retraces at least
half of the preceding multi-week rebound. However, it isn't reasonable to rely
on the SPX tracking the 2011 path so precisely, which is why we have outlined
three different ways of entering a short-term bearish speculation.
Argentina
There will be a presidential election in Argentina on 25th October, with a
second round to be held on 22nd November if the first round is not sufficiently
decisive. As a result of this election Argentina will end up with a new
president, but the victor will almost certainly be from the same party as the
current president. This probably means that Argentina is not going to get a
respite from economically-destructive policy-making over the years immediately
ahead.
One of Argentina's biggest economic problems is inflation of both the monetary
kind and the price kind, with the latter being a consequence of the former.
Argentina's government admits to "price inflation" of around 14%, but
non-government sources indicate that the actual pace of purchasing-power loss is
close to double the official number. The dramatically faster rate of "price
inflation" quoted by non-government sources is probably in the right ballpark
since it is consistent with the country's rapid pace of money-supply growth.
The stock market can benefit from rapid monetary inflation, even when the
monetary inflation is causing a blatant "price inflation" problem. The reason is
that stocks are claims on real assets. In a high-inflation environment it is
therefore usually much better to bet against bonds than against stocks.
Prior to the past few months Argentina's stock market was holding up quite well,
even when its performance was measured in US$ terms. In fact, although the top
half of the following chart shows that the Global X Argentina ETF (ARGT) made
new 2-year lows during September-October, the bottom half of the same chart
shows that ARGT has essentially gone nowhere (in an interesting way) over the
past two years relative to emerging-market equities in general. In other words,
relatively bad policy-making hasn't yet led to relatively bad performance by
Argentina's stock market.
This is more evidence that stock-market performance is often a poor indicator of
economic performance.
Gold and the Dollar
Gold
The US$ gold price has pulled back from last week's high. In the process it has
dropped below its 200-day MA and important lateral support/resistance at $1170,
thus negating the recent upside breakout. What does this tell us about the
future?
It tells us very little. Although last week's upside breakout has been negated,
the price action over the past 5 trading days currently has the look of a
routine consolidation. There is not yet any evidence of a short-term trend
reversal from up to down.
Gold has short-term lateral support in the mid-$1150s defined by the
late-September high and short-term support in the low-$1150s defined by the
20-day MA. Once the 20-day MA rises to meet lateral support in the mid-$1150s,
which is something that will happen in the next two days, the mid-$1150s will
become trend-defining support. In other words, a daily close below this support
would then signal a short-term trend reversal from up to down.
As an aside, confirmation of a trend change often doesn't happen until after the
price has moved a significant distance in the direction of the new trend. This
is why it can often make sense to do some selling after the market in question
has become short-term 'overbought' but before there is any evidence that the
rally has ended.
At this stage the odds favour the 'routine short-term consolidation' view, in
which case the gold price won't close below the mid-$1150s before resuming its
rally and rising to a new multi-month high. That being said, we do not expect
that gold will do any better over the next couple of months than rise to the
$1220s. That is, we think that the maximum realistic short-term target for the
US$ gold price is only about 3% above last week's high.
Gold Stocks
Like gold, the HUI has pulled back over the past 5 trading days. Also like gold,
there has been nothing in the HUI's price action to suggest that the pullback is
anything more serious than a routine consolidation within a short-term upward
trend. Note that in the gold-mining sector, short-term consolidations within
upward trends often last 5-8 trading days.
A minor positive divergence between gold and the HUI over the past three trading
days adds some weight to the 'routine consolidation' view. We are referring to
the fact that on Wednesday 21st October, the US$ gold price closed below
Monday's low while the HUI closed above Monday's low.
At this stage a rise by the HUI to the low-150s remains a realistic short-term
possibility. However, the following comment from the email sent to subscribers
early this week is worth repeating:
"Bear in mind...that although last week's high for the HUI was 10% below the
level that we considered both a likely and a maximum short-term upside target,
the two most important gold-stock ETFs reached the lower ends of the upside
target ranges mentioned in recent TSI commentaries. Specifically, GDX reached
the lower end of the $17-$18 range and GDXJ reached the lower end of the
$23.50-$24.00 range. Also, GDXJ touched its 200-day MA before pulling back
sharply over the past two trading days."
The chart displayed below shows that GDXJ not only touched its 200-day MA last
week, but also touched its channel top. In effect, GDXJ has already reached the
HUI equivalent of the low-150s.
Updates on Stock Selections
Notes: 1) To review the complete list of current TSI stock selections, logon at
http://www.speculative-investor.com/new/market_logon.asp
and then click on "Stock Selections" in the menu. When at the Stock
Selections page, click on a stock's symbol to bring-up an archive of
our comments on the stock in question. 2) The Small Stock Watch List is
located at http://www.speculative-investor.com/new/smallstockwatch.html
Chart Sources
Charts appearing in today's commentary
are courtesy of:
http://stockcharts.com/index.html
![]()