![]()
![]()
![]()
![]()
- Interim Update 21st October 2020
Copyright
Reminder
The commentaries that appear at TSI
may not be distributed, in full or in part, without our written permission.
In particular, please note that the posting of extracts from TSI commentaries
at other web sites or providing links to TSI commentaries at other web
sites (for example, at discussion boards) without our written permission
is prohibited.
We reserve the right to immediately
terminate the subscription of any TSI subscriber who distributes the TSI
commentaries without our written permission.
The increasing risk of
hyperinflation
This year has been nothing if
not interesting. Many unprecedented things have happened, one example
being the performance of the US Industrial Production (IP) Index. As shown
below, IP effectively fell off a cliff during March-April of this year.
During May-July it climbed about half-way back up the cliff face before
stopping in its tracks over the past two months. Nothing like this ever
happened before.
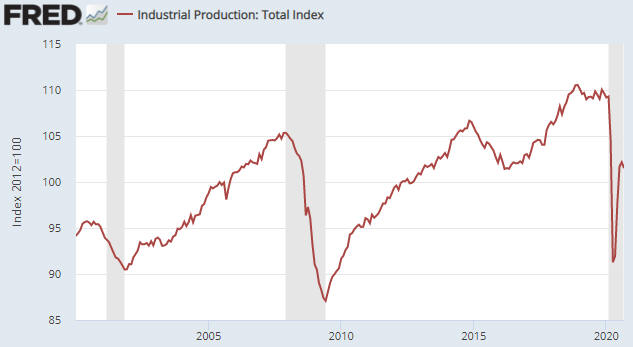
When we say nothing like this ever happened before we are referring to
the speed of the change. In magnitude terms the IP Index suffered a
similar peak-to-trough decline during the Global Financial Crisis, but
what took eighteen months during 2007-2009 took only two months in 2020.
And after the 2007-2009 recession it took about two years for the IP Index
to recover half of what it lost, as opposed to three months in 2020. In
other words, what took 3.5 years during 2007-2011 took only five months in
2020.
The reason for the unprecedented speed of this year's
collapse is that the US economy didn't fall off a cliff; it was pushed.
The government (meaning: politicians and bureaucrats at the federal and
state levels) deliberately crashed the economy. Policymakers then mounted
such an extraordinary rescue attempt that personal income actually rose
while the economy crashed and unemployment soared, which explains the
unprecedented speed of the rebound.
The economic recovery stalled
over the past two months (the IP Index for September was roughly the same
as the IP Index for July), mainly because the government slowed the pace
at which it was doling out 'free' money. The pace of the government's
money distribution is bound to ramp up after the November election, which
probably will enable the economy to look strong during the first half of
next year. However, there is no chance of a self-sustaining recovery. The
main reason is that deluging the populace with newly created money does
nothing to repair the damage caused by the lockdowns. On the contrary, it
leads to capital consumption and sets the stage for another plunge into
recession territory.
The biggest risk, however, isn't that the
'stimulus' efforts won't work and that the US economy will be back in
recession within the next two years. That's more of an inevitability than
a risk. The risk of greatest concern is that policymakers will become even
more aggressive in their misguided efforts to help and that these efforts
will lead to hyperinflation.
For the first time since we started
publishing these reports two decades ago, we cannot write that the
probability of the US experiencing hyperinflation within the next two
years is close to zero. The probability isn't high, but it is significant.
The Rare Earth
Opportunity
Due to the use of Rare Earth
Elements (REEs) in the manufacture of critical components in some of the
highest-growth industries and technologies, including clean energy,
electric vehicles and 5G networks, REEs as a group possibly have the
highest reward/risk ratio in the commodity universe. The problem for we
speculators/investors is that there are very few real companies with
economic or potentially-economic REE deposits listed on developed-world
stock markets. In alphabetical order, a few of the companies/stocks that
we are familiar with are:
1) Arafura Resources (ARU.AX), a current
trading position in the TSI Stocks List. ARU has a market cap of around
A$120M and is developing the Nolans project in Australia's Northern
Territory. This project focuses on the light rare earths Neodymium (Nd)
and Praseodymium (Pd), and is fully permitted with a completed Feasibility
Study (FS). The start of mine/plant construction is pending offtake
agreements and financing (about A$1B will be needed to put the project
into production).
2) Mkango Resources (MKA.V), a current member of the TSI Small Stocks
Watch List (SSWL). MKA has a market cap of only A$21M and is developing
the Songwe Hills project in Malawi (Africa) in partnership with Talaxis.
This project focuses on Nd-Pr and is undergoing a Feasibility Study.
In terms of current market cap relative to project value, MKA probably
has the greatest upside potential in the REE stock universe. However, it
is very thinly traded (some days it doesn't trade at all) and therefore
should be approached with caution.
3) Northern Minerals (NTU.AX), which has not been mentioned at TSI in
the past but as of now is a member of the SSWL. NTU is developing the
Browns Range Heavy Rare Earth project in the Kimberley region of Western
Australia. This project focuses on the heavy REs, with Dysprosium (Dy) and
Erbium (Er) being the most important outputs. Dy is used to make the
DyNdFeB magnets that go into EV motors and clean energy applications, and
Er-doped fibre is used in the plumbing of 5G networks.
NTU is in
small-scale production via a pilot plant and could become a takeover
target.
The company's share count 'blew out' earlier this year due
to a large equity financing priced at only A$0.02/share. Thanks to this
financing the balance sheet is now healthy, but the share count is massive
at around 4.4 billion. At the current share price of A$0.036 the market
cap is around A$160M.
4) Rare Element Resources (REEMF) has not been mentioned at TSI in the
past but as of now is a member of the SSWL.
In some ways, REEMF is
not a serious company. For example, it doesn't trade on a proper stock
exchange (not even the TSXV), only on the US OTC market. Also, it has not
completed any engineering studies since the Pre-FS in 2014, the latest
presentation at the company's web site is more than four years old, and
the share count at the company's web site has not been updated since 2017
(the current share count is more than 10 times the 9.6M figure quoted at
the web site). Anyone thinking about buying the stock should take these
issues into account. However, the company's Bear Lodge project in Wyoming
may well contain the best undeveloped REE deposit in the US.
If
Bear Lodge is ever put into production its most important outputs will be
the REE elements Cerium (Ce), Lathanum (La), Nd and Pr.
At the
current share price of US$0.57 the company's market cap is about US$60M.
The Stock Market
The S&P500 Index (SPX)
consolidated over the first three days of this week. We suspect that it
will maintain a downward bias between now and the early-November US
election unless there is good news on the 'stimulus' and/or vaccine
fronts.
Gold and the Dollar
Gold
Over the first three days of this week there was a small rebound in the
US$ gold price that ended at resistance.
It was the same story for the euro gold price.
It was also the same story for the US$ silver price, except that
silver's rebound is yet to reach resistance (nearby resistance is at
US$26.00).
A number of markets, including gold and silver, have reached critical
junctures, meaning that they can't move much further in the directions of
the past few days without signalling short-term trend changes. In the
cases of gold and silver, it wouldn't take much additional strength from
here to signal an end to the corrections that began in early-August.
Consequently, within the next few days we probably will get either
downward reversals or evidence that new multi-month rallies are underway.
What we get in the near future in the gold and silver markets will be
determined primarily by the currency market. The US$ gold price currently
has a strong negative correlation with the Dollar Index (DX) and the
following chart shows that the DX has dropped to within half a point of
its low. If the DX reverses upward from near its current level then it
will have successfully tested its August low and will be poised to resume
its multi-month countertrend rebound, thus setting the stage for the gold
price to make a new multi-month low. Alternatively, if the DX breaks below
its August low then it will be reasonable to assume that gold has resumed,
or is about to resume, its multi-year upward trend.
Gold Stocks
The gold mining indices/ETFs had
slightly bearish price action over the first three days of this week, with
a sizable decline on Monday followed by a lacklustre rebound over the
ensuing two days. As illustrated below, the HUI's rebound ended on
Wednesday at the 50-day MA.
The price action mentioned above leaves the door open to a
correction-ending plunge by the HUI to the 260-290 range. At the same time
and along the lines of what we wrote in the Gold discussion above, it
wouldn't take much strength from here to signal an end to the correction.
Below is a chart of something we haven't discussed in many months.
The chart shows GDX's Advance-Decline Line (ADL) and the ADL's 50-day MA.
The ADL peaked in July, about two weeks prior to GDX and the HUI,
and has since experienced a much larger correction than GDX itself. In
particular, whereas the corrections in GDX and the HUI since their
early-August peaks look like routine short-term consolidations, GDX's ADL
has experienced one of its largest multi-month declines of the past 5
years. Currently it looks similar to the declines that occurred during the
second half of 2016 and the first half of 2019.
Based on
fundamental considerations, we think that the current ADL decline is more
like the H1-2019 episode than the H2-2016 episode. In other words, we
expect that the current decline will be followed by a rise to a new
12-month high. In both of the earlier cases, however, a break by the ADL
above its 50-day MA signalled that a tradable rally had begun.
The Currency Market
We've had a target of 68
in mind for the Australian dollar (A$) correction that began in
late-August. This target still looks valid, but if the DX breaks to new
lows for the year (below 92) it will imply that the A$ correction ended
two points higher than expected.

When it eventually happens, a breakdown in the DX should be respected.
We mean that such an event should be taken as confirmation that the
"stagflation" theme has returned to centre-stage and that another general
commodity-price rally has been set in motion. Note, though, that if the DX
were to break out to the downside in the near future it would be doing so
with speculators already carrying massive anti-US$ exposure via huge bets
on the euro and copper in the futures markets and a huge bet on gold ETFs.
This sentiment backdrop would increase the risk of going 'long' the
obvious anti-US$ trades, but it still would be the right thing to do.
Updates on Stock Selections
Notes: To review the complete list of current TSI stock selections, logon at
http://www.speculative-investor.com/new/market_logon.asp
and then click on "Stock Selections" in the menu. When at the Stock
Selections page, click on a stock's symbol to bring-up an archive of
our comments on the stock in question.
![]() A
new location for the TSI Small Stocks Watch List (SSWL)
A
new location for the TSI Small Stocks Watch List (SSWL)
The SSWL is a list of stocks that are too risky and/or illiquid to be
considered for the TSI Stocks List. We don't track these stocks closely in
the TSI commentaries, but they have favourable risk/reward ratios (in
general: high risk versus much higher potential reward) and could be of
interest to speculators who are able to do their own due diligence.
Up until now the SSWL was a separate page at the TSI web site, bit for
ease of reference we have added it to the bottom of the table at the Stock
Selections page (below the Options list).
 Comment on Jervois Mining (JRV.AX, JRV.V)
We
removed JRV from the TSI Stocks List on 17th August and explained the
decision as follows:
"The updated FS for JRV's Idaho Cobalt
Operation (ICO) should be ready for public release by the end of
September-2020. We had planned to make a retain/remove decision about JRV
following receipt of this information, but the plan has changed. Due to
the recent run-up in JRV's price we think it makes more sense to exit now
and re-evaluate the stock after receipt of the FS. The reason is that the
company's current market cap (A$205M) goes a long way towards discounting
a positive FS and therefore makes the stock vulnerable to disappointing
news.
JRV has gained 62% since its addition to the List in May of
last year and is up by 56% year-to-date."
The company has
since published the updated FS for the Idaho Cobalt Operation (ICO) and
the stock price is the same now as it was then.
The "base case"
figures contained in the FS reveal a project with very positive economics,
but the base case uses a cobalt price of US$25/pound. At the current
cobalt price of around US$15/pound, the project is not remotely close to
being viable.
The stock of a company with a Feasibility-Stage
mining project that is well out of the money at current metal prices can
be a good speculation if the stock's valuation is low enough, but that
isn't the case with JRV. In our opinion, JRV's current market cap
discounts a US$30/pound cobalt price. To put it another way, the cobalt
price would have to double from here just to bring JRV's valuation into
line with its current market cap.
Needless to say, JRV doesn't
appeal to us at its current valuation.
Chart Sources
Charts appearing in today's commentary
are courtesy of:
https://stockcharts.com/
http://bigcharts.marketwatch.com/
https://research.stlouisfed.org/
![]()