|
- Interim Update 21st December 2011
Copyright
Reminder
The commentaries that appear at TSI
may not be distributed, in full or in part, without our written permission.
In particular, please note that the posting of extracts from TSI commentaries
at other web sites or providing links to TSI commentaries at other web
sites (for example, at discussion boards) without our written permission
is prohibited.
We reserve the right to immediately
terminate the subscription of any TSI subscriber who distributes the TSI
commentaries without our written permission.
Holiday Season Schedule
and Message
There will be no Weekly Update this coming Sunday (25th December) or the following Sunday (1st January). We will, however, post an Interim Update at around the usual time next week (29th December).
Thank you for your support over what turned out to be a difficult year for the speculations that we focused on. Next year will hopefully be a lot more profitable. It probably will be, as these things go in cycles.
We wish you a joyful Christmas and a very successful (in all ways) 2012! The
potential for more "QE" in 2012
It has always been clear to supporters of "Austrian" economic theory that Quantitative Easing (QE) could only hurt the economy. The fact that the US economy is weaker now than it was at the start of the "QE2" program is therefore not the slightest bit surprising to the "Austrians". What is a little surprising is that there now seems to be wider understanding that QE can't possibly help.
The wider understanding of the problems caused by money printing creates a challenge for the Fed, because the Fed is like the proverbial man with a hammer who views everything as a nail. To be more specific, in the Fed's playbook under the heading "actions to take in a weak economy" there is only one play: "Cut interest rates and pump money". This all but guarantees that if the US economy continues to weaken then the Fed will, at some point, cause a lot of new money to be pumped into the economy.
The challenge that will likely face the Fed in 2012 is to follow its playbook (pump more money, that is) without attracting unbearable negative attention. One way to do this is to simply lie. A good example of the lying tactic was seen over the past fortnight, when Bernanke told Congress that the Fed would not attempt to bail out European banks at the same time as the Fed was channeling tens of billions of dollars to these banks via the ECB. However, the usefulness of the lying tactic is severely limited by the fact that regardless of how the Fed creates new money, if it does so directly then the evidence will appear somewhere on its balance sheet. Last week's provision of new money to European banks, for example, caused the Fed's balance sheet to balloon by $52B.
As we explained in October, the easiest way for the Fed to meet this particular challenge would be to pump money INDIRECTLY via the commercial banks. It could do this by creating an irresistible incentive for commercial banks to monetise Treasury bonds and other securities. In this way the money supply could be made to increase substantially, but there would be no official QE and no ballooning of the Fed's balance sheet.
Our guess is that the next round of US$ inflation will be prompted by the Fed but will be directly carried out by the commercial banks. Based on recent announcements and actions, this is similar to the route that the ECB has already taken in its efforts to maintain central bank credibility while promoting inflation.
Our final point before moving on is that there is nothing to be gained and a lot to be lost by aggressively buying or selling in ANTICIPATION of changes in the monetary inflation rate. The reason is that prior to the late stages of an inflation cycle there will generally be plenty of time from a change in the money-supply growth trend to the change being properly discounted by the financial markets. That is, we should wait for evidence that the Fed has stepped more firmly on the monetary gas pedal before positioning ourselves for accelerating US$ inflation.The Stock Market
There is way too much optimism IF our economic outlook is correct
The cover story in the latest issue of Barrons Magazine was based on a survey of and interviews with Wall Street strategists. The survey and interviews focused on the 12-month outlook for the US stock market, which means that the article provides a good overview of the sentiment of people who reflect and influence overall market sentiment. We got the impression from this article that current sentiment can aptly be described as mixed and that there is considerable scope for a negative surprise. There is also some scope for a positive surprise, but a positive surprise isn't something to worry about unless you happen to be net-short.
Here is the first of what we consider to be the article's two most important paragraphs:
"The mean prediction of the 10 stock-market strategists and investment managers surveyed by Barron's is that the Standard & Poor's 500 Index will end 2012 at about 1360, some 11.5% higher than Friday's close of 1220. That sounds like a big gain, but a lot of things have to go right for the market to make such impressive headway. Even the most bullish of these Street seers fears stocks could be more wobbly in the next six months than in the six months past."
In other words, there's a general expectation among strategists that the US stock market will gain about 10% next year and that the bulk of the gain will occur during the second half of the year. We found it interesting that the average analyst expects the first half of 2012 to be rockier than the second half, because if we were forced to make a prediction we'd say that the market will probably hold up OK during the first half and then tank during the second half after the evidence of global recession becomes undeniable.
Here is the other important paragraph:
"Then there are questions about the growth of U.S. corporate profits. The top-down call, or that of Wall Street's market strategists, is that earnings per share will rise about 7% in 2012, to $105, for companies in the S&P 500, from this year's estimated $98. The typically more optimistic bottom-up crowd of industry analysts calls for a 10% increase, to $108, although that forecast is down from an estimate of $113 in July. Analysts' earnings estimates have been falling around the world, and both top-down and bottom-up projections for next year are lower than the 15% growth rate likely in 2011."
The general view that the market will rise 10% next year is clearly based to a large degree on the general view that corporate earnings will rise 7%-10% next year. The earnings outlook is where we see the potential for a big negative surprise, because reliable leading economic indicators combined with today's elevated profit margins mean that there is a distinct possibility of the S&P500's earnings FALLING by 20% or more next year. If next year's S&P500 earnings turn out to be around $80 rather than the $105-$108 presently expected by the average analyst, then this index would be fully valued at 950-1000 (about 20% below Wednesday's close).
Current Market Situation
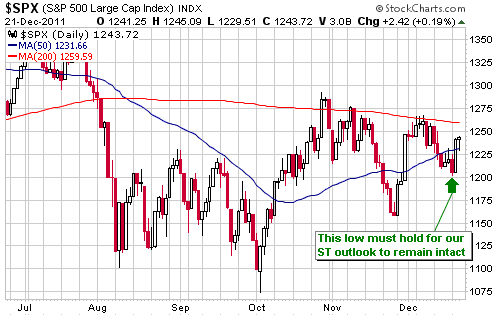
Tuesday's strong rebound suggests that a pullback low was put in place on Monday and that a rebound into January has commenced. Monday's intra-day low of around 1200 for the S&P500 Index is now important, as closing below this level at any time would be a significant bearish deviation from the expected pattern.
Gold and the Dollar
Gold
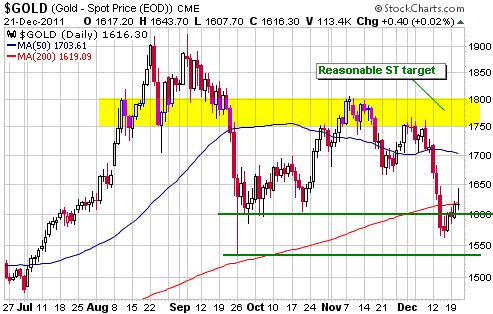
Gold probably made a bottom of at least short-term significance last week. If so, the bottom was put in place when almost everyone was worrying about how much farther the price would fall. Evidence of the worry is last week's decline to 58% in the bullish percentage determined by the Market Vane sentiment survey. This was a new 2-year low in 'bullishness' and was only 9 points above the 5-year low reached when gold spiked down to around $700/oz at the crescendo of the 2008 market collapse.
There's no guarantee that the current rebound won't be followed by a decline to a new multi-month low. Such guarantees never exist, so don't bother looking for them. Just focus on doing the right thing based on the real-time evidence. Doing the right thing usually involves getting more bullish as 'the herd' becomes increasingly worried about downside risk. This approach works because 'the herd' tends to be most worried about downside risk after the price has fallen to the point where downside risk is minimal.
As succinctly put by Rick Rule: In the financial markets you are either a contrarian or a victim.
A daily chart of the US$ gold price is displayed below. Although gold probably reached a short-term price low last week, it wouldn't surprise us if it went a little lower at some point over the next few weeks -- say, to the low-$1500s. On the other side of the coin is the prospect of a rebound to $1750-$1800, or perhaps higher if central bankers decide to become even more aggressive on the monetary inflation front.
On a short-term basis silver is in a similar position to gold, but there is less chance that silver's recent bottom will turn out to be the intermediate-term variety.
Gold Stocks
Are gold ETFs partly responsible for the gold sector's relatively poor performance?
The ZeroHedge article posted HERE
discusses the conclusion of recent analysis by Goldman Sachs (GS) that the introduction of easier ways to obtain direct exposure to gold bullion has a lot to do with the weakness in gold mining shares relative to gold bullion. The GS conclusion is supported by the fact that the general inability of gold shares to provide upside leverage to the gold price began in 2004, at around the same time that the most popular gold bullion ETF (GLD) was born. However, as discussed
HERE, just because one event follows another or two charts look similar doesn't mean that there is a causal relationship involved.
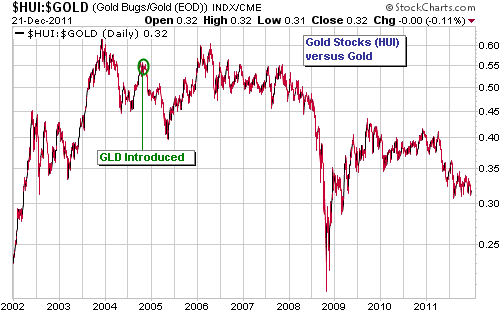
The claim that the relative weakness of gold shares is partly due to the proliferation of easier ways to get direct exposure to gold bullion is a lot more plausible than the claim that the gold sector's relatively poor performance is largely the result of "naked short selling". There is, at least, some logic to it and some empirical evidence to support it. The increasing popularity of gold bullion ETFs certainly COULD have had a depressing effect on the mining shares. But what if this is the case? Where does it leave us? Does it mean that rather than having exposure to both the bullion and the shares, from now on we should obtain all of our gold exposure via the bullion?
We want to emphasise that the under-performance of the shares can be explained in other ways and is consistent with what happened during the previous long-term bull market. In one of our next two commentaries we will expand on this point by doing another chart-based comparison between the current and previous gold bull markets. However, even if it is the case that gold bullion ETFs are responsible for some of the relative weakness in the mining shares it doesn't give us anything to go on as far as our future actions are concerned. The reason is that the under-performance has already occurred to the extent that the intermediate-term risk/reward is now definitively skewed in favour of the shares. To put it another way, it doesn't make sense to bet on additional strength in the bullion relative to the mining shares with the shares having already fallen to ultra-depressed levels relative to the bullion.
Current Market Situation
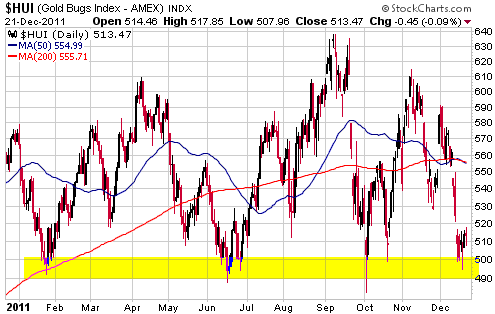
The HUI dropped to the middle of its 490-500 support range on Monday and then rebounded. There is no evidence that a price low is in place, but we continue to believe that a near-term break below 490-500 would be followed by a decline to no lower than 470.
470 probably defines the additional downside potential assuming that 490 is breached within the next couple of weeks. This is because gold stocks, as a group, are almost as 'oversold' as they ever get at intermediate-term price lows. However, the downside potential would be significantly greater if the HUI were to rebound over the next few weeks and then take out support. In other words, if the HUI is going to breach support it would be better for the bulls if it did so now rather than later.
By the way, this is the last week that tax-loss selling will have a significant effect on the prices of junior gold and silver stocks.
Currency Market Update
In one day this week the ECB provided commercial banks in Europe with 489B euros of low-cost money via its recently announced LTRO (Long Term Refinancing Operations) program. Apparently, 193B euros (the equivalent of about US$250B) constituted new money while the remainder replaced existing credit facilities. To put it another way, in a single day this week the ECB created about 40% as much new money as the Fed created during its entire 8-month QE2 program.
The LTRO program is in addition to the 20B euros per week (the equivalent of around US$1.3 TRILLION dollars per year) that the ECB has said it is prepared to spend on sovereign debt purchases. And yet, we keep hearing that the ECB isn't sufficiently loose!
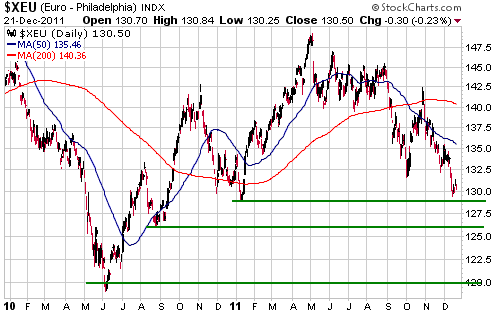
Evidence of more monetary inflation, regardless of whether the inflation is in the US$ supply or the euro supply, usually gives the euro's FX value a short-term boost. It is therefore interesting that the euro has shown very little strength over the past few days. Sentiment indicators continue to suggest that the euro is close to a multi-month bottom in terms of time, but the price action continues to suggest that a meaningful turning point is not yet at hand.
If the euro's recent low is taken out, the most likely level for a bottom would be support at around 126.
Update
on Stock Selections
Notes: 1) To review the complete list of current TSI stock selections, logon at
http://www.speculative-investor.com/new/market_logon.asp
and then click on "Stock Selections" in the menu. When at the Stock
Selections page, click on a stock's symbol to bring-up an archive of
our comments on the stock in question. 2) The Small Stock Watch List is
located at http://www.speculative-investor.com/new/smallstockwatch.html
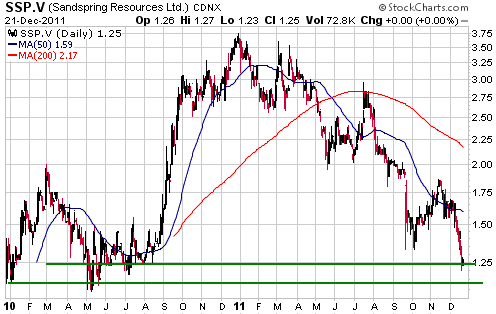
 Sandspring Resources (TSXV: SSP). Shares: 108M issued, 120M fully diluted. Recent price: C$1.25 Sandspring Resources (TSXV: SSP). Shares: 108M issued, 120M fully diluted. Recent price: C$1.25
The weakness in some exploration-stage gold stocks can be partly explained by negative company-specific news, but in most cases the weakness is solely the result of the overall market environment (including tax-related selling). Guyana-based SSP, for example, has announced only good news over the past few months and continues to increase in fundamental value, but after showing some resilience for a while its stock price has lately fallen victim to the general market malaise and the effects of tax-loss selling. This creates a buying opportunity ahead of a resource update and Preliminary Economic Assessment due early next year.
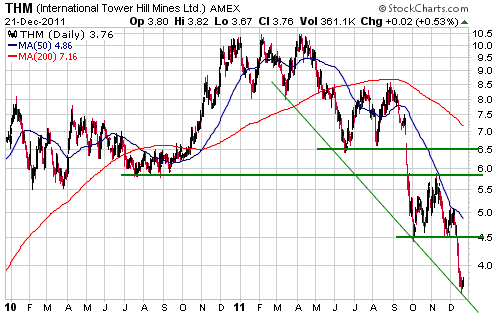
 International Tower Hill Mines (AMEX: THM, TSX: ITH). Shares: 85M issued, 90M fully diluted. Recent price: US$3.76
Like SSP, THM has taken a big hit in the stock market despite improving fundamentals. The plunge in its market value since the beginning of this month probably has a lot to do with tax-related selling, but the market-wide decline in the demand for speculative stocks has been the primary driver of the downward trend that began in April.
We didn't expect that there would be an opportunity to buy THM below US$4.00, but here we are. THM's Alaska-based Livengood project is one of the best undeveloped gold deposits in North America, and you can now buy into it for less than $20/oz (using a relatively conservative 0.50-g/t cutoff grade for the resource estimate).
 Evolution Mining (ASX: EVN) (Formerly Catalpa Resource, CAH). Shares: 693M issued, 709M fully diluted. Recent price: A$1.50
In the 9th November Interim Update we wrote that EVN would be a strong buy if it dropped back to the low-A$1.50s. It is now a strong buy.
 Don't forget about the uranium juniors
In the 22nd November Interim Update, we wrote:
"The Aston Hill Global Uranium Fund (TSX: GUR) is another option worth considering for diversified uranium-mining exposure, but only if you don't mind dealing with illiquid securities. GUR is a tiny fund that trades like an illiquid penny stock (GUR's average daily trading volume is only around 6K and its buy-sell spread is often wide), but you can make a lack of liquidity your friend if you trade small. You do this by buying when incremental selling pressure causes a disproportionately large downward spike, and by selling when incremental buying pressure causes a disproportionately large upward spike.
Given that it is illiquid and a long way below the price at which it began 2011, GUR stands a good chance of being affected by tax-loss selling over the next four weeks. This could create buying opportunities for small-scale speculators."
GUR.TO closed at C$1.60 on Wednesday, which is near its low of the past 2.5 years (see chart below). If you can tolerate the lack of liquidity, now is a good time to be accumulating this fund. If you prefer a more liquid fund, URA has also fallen to a level where new buying could be appropriate.
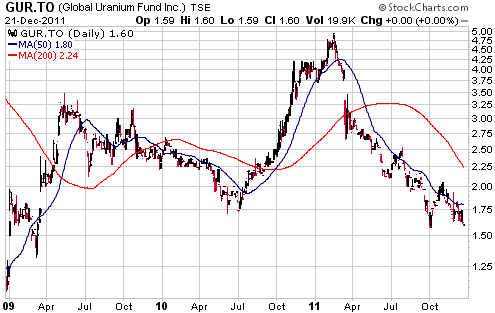
Chart Sources
Charts appearing in today's commentary
are courtesy of:
http://stockcharts.com/index.html

|

