![]()
![]()
![]()
![]()
- Interim Update 22nd March 2017
Copyright
Reminder
The commentaries that appear at TSI
may not be distributed, in full or in part, without our written permission.
In particular, please note that the posting of extracts from TSI commentaries
at other web sites or providing links to TSI commentaries at other web
sites (for example, at discussion boards) without our written permission
is prohibited.
We reserve the right to immediately
terminate the subscription of any TSI subscriber who distributes the TSI
commentaries without our written permission.
Commodities
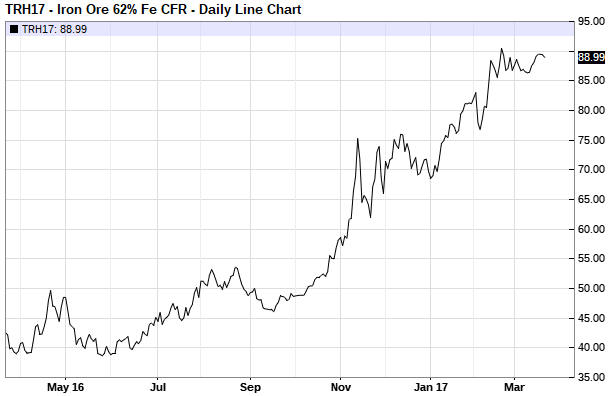
Iron-Ore
There is evidence in the price action that many commodity markets are
entering intermediate-term declines (in the cases of oil and copper) or
extending the intermediate-term declines that began last June (in the
cases of some agricultural commodities, including the grains). However,
one of the commodity world's leaders to the upside since the early-2016
bottom has not yet shown any signs of weakness. We are referring to
iron-ore.
As illustrated by the following daily chart of the
March-2017 Iron-Ore futures contract, the iron-ore price remains near the
multi-year high achieved last month.
A daily close below $80 in the
nearest futures contract would be preliminary evidence of an
intermediate-term top in the iron-ore market. A weekly close below $75
would be conclusive evidence.
Platinum
Of the so-called "precious" metals,
platinum has the best intermediate-term risk/reward. However, it's quite
possible that the decline in the platinum price from its August-2016 peak
is not yet complete. A break below the January-2016 low is very unlikely,
but a test of the low is a realistic possibility.
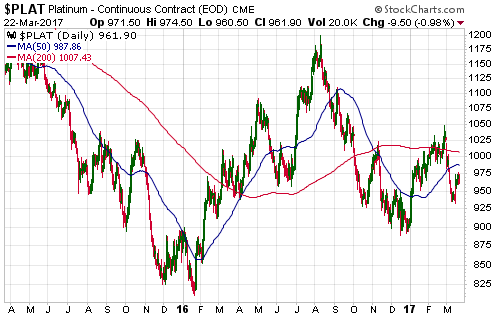
As mentioned in a TSI commentary at the time, we bought an initial
position in physical platinum at around US$930/oz last October. We have
since been waiting for the right opportunity to add to the position, but
have been holding out for a lower price (having already bought about half
of our planned full position we can afford to be stingy). Specifically, we
are hoping to be able to buy at $850 or lower.
An opportunity could
arise to buy platinum at $825-$850 during the second quarter of this year.
If so, grab it!
Uranium
In mid-February the
price of the Global X Uranium ETF (URA), a fund that holds uranium-mining
equities, briefly traded above US$19/share. At that time the uranium price
was about $25/pound. The uranium price is still about $25/pound, but URA's
price has plunged to around $15.
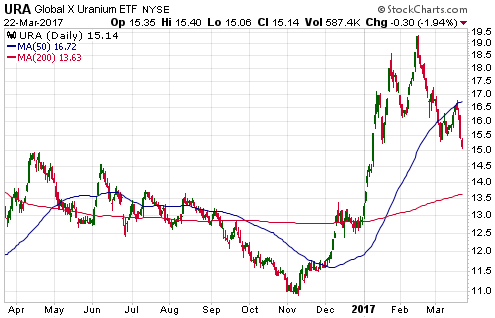
URA has gone down a lot relative to the uranium price over the past 5
weeks because over the 3 months prior to that its gain was
disproportionately large. As we noted at the time, the uranium-mining
sector got way ahead of itself. Specifically, it seemed to us that URA was
already priced for $35/pound uranium when uranium was trading in the
low-to-mid-$20s during January-February.
With the commodity having
held its ground near $25/pound and URA having quickly dropped by more than
20% from its February high, URA is starting to look attractive. In fact,
uranium remaining near $25 and URA dropping to the vicinity of its 200-day
MA (currently at $13.63) would create a very good buying opportunity.
We removed URA from the TSI Stocks List after it spiked above $19 in
February and will return it to the List if it trades at $14.00 before the
end of April.
Gold is Different
Gold is different from other
commodities. It is different because whereas other commodities are
consumed in commercial processes, only a tiny fraction of the gold that
gets produced each year gets consumed in this way. Instead, almost all
gold gets held in readily-saleable form for speculative, insurance or
store-of-purchasing-power purposes. It happens this way because of the
subjective valuations of individuals throughout the world, not because
there is something inherently magical or mystical about gold. More
specifically, due to its physical properties and relative scarcity, gold
is widely considered to be at its most useful (valuable) when it is
sitting in a vault.
A consequence is that gold's supply/demand
situation is very different from that of any other commodity. For example,
in the gold market the supply side of the equation is dominated by the
existing above-ground stock to the extent that changes in the annual rate
of gold-mining output are irrelevant to the price.
With gold's
fundamental price drivers being different from those of other commodities
we would expect the inflation-adjusted (IA) long-term performance of gold
to be markedly different from the IA long-term performance of a
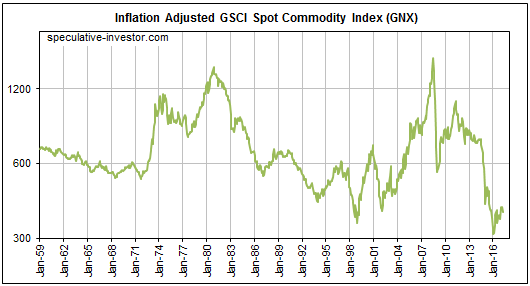
broad-based commodity index such as GNX (the GSCI Spot Commodity Index).
As illustrated by the following monthly charts of the IA US$ gold price
and the IA GNX, this is, indeed, the case.
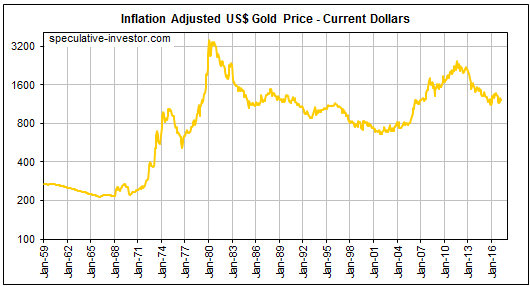
[Notes: 1) In the above charts, prices are adjusted for
"inflation", that is, converted to current dollars, using
the method we first outlined in 2010. This method will
probably be inaccurate during any given year but should be far more
accurate than any of the popular alternatives over the long-term. 2) The
GNX chart uses CRB data until 1992 and GNX data thereafter.]
Notice that at the early-2016 low the general level of commodity prices
had fallen to its lowest level in at least 60 years in IA terms. At the
same time, the IA gold price was in the top half of its 60-year range.
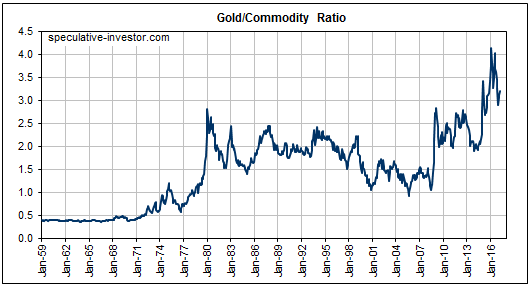
This rather dramatic relative strength on gold's part is illustrated by
the following long-term chart of the gold/GNX ratio and reflects the
fundamental differences between gold and the average commodity. Whereas
almost all other commodities have been getting cheaper (in real terms)
over the past 50 years due to technological progress, gold has been
getting more expensive due to the increasing desire to have money-like
savings outside the official monetary system.
The Stock Market
The US
Current Market Situation
There was
a bit of excitement in the US stock market on Tuesday 21st March when the
S&P500 Index (SPX) suffered this year's first daily loss of more than 1%,
but it will take a lot more than a single daily decline of 1.2% to do
significant damage to the market's relentless upward trend. That being
said, every significant market move has to start somewhere.
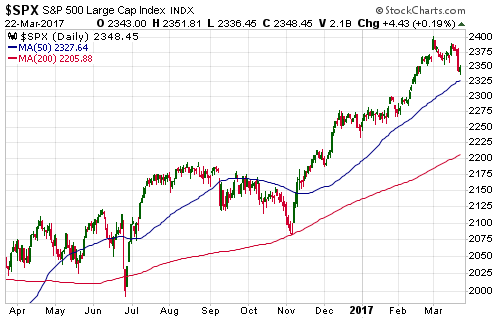
As mentioned in the latest Weekly Update, an important top in the US
stock market is likely to be signaled by the Russell2000 SmallCap Index
(RUT) and/or the Dow Transportation Average (TRAN) well before it is
signaled by the SPX. This is because RUT and TRAN are much closer to
trend-defining support levels. These support levels are 1340 for RUT and
9000 for TRAN.
RUT and TRAN ended Wednesday's session at 1345 and
8987, respectively, so the above-mentioned support levels are currently
being tested. They must be breached on a weekly closing basis to clearly
signal a reversal, which means that it will take only a small amount of
additional weakness over the coming two trading days to generate reversal
signals.
US bank stocks are becoming
relatively weak
One of the most notable characteristics of
the US stock market during the second half of last year was the relative
strength of the banking sector, as indicated by the powerful advance in
the BKX/SPX ratio. There has, however, been a pronounced reversal in the
banking sector's relative performance over the past three weeks.
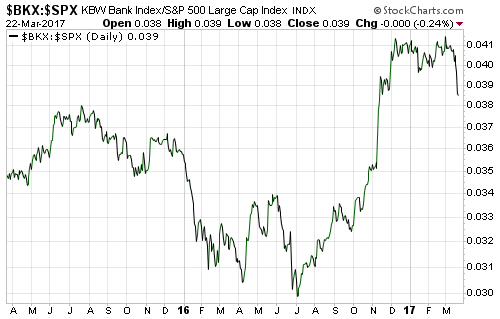
The recent sharp decline in the BKX/SPX ratio is important if it is
marking the start of a new multi-month trend. This is because optimism
about the prospects for banks and other financial institutions has been
one of the main reasons for the stock market's resilience. Take away this
prop and the entire market becomes a lot more vulnerable, at least until a
new bullish narrative can be found.
Also of interest to us and many
of our readers is that the relative performance of the banking sector is
one of gold's fundamental price drivers, with a relatively strong banking
sector indicating rising confidence in the financial system and therefore
being bearish for gold. If the banking sector is in the process of
becoming relatively weak then one of gold's true fundamentals is in the
process of shifting from bearish to bullish.
Gold and the Dollar
Gold
Despite having just risen for 6 trading days in a row, the gold market is
not yet 'overbought'. However, the following daily chart shows that the
US$ gold price has reached trend-line resistance.
Support and
resistance defined by angled lines drawn on charts is always somewhat
arbitrary, because the lines can be in different places depending on the
scale of the chart and the subjective assessment (eye) of the person doing
the drawing. That's why we refer to them as "subjective"
support/resistance. "Objective" support/resistance is defined by previous
highs/lows and is generally more important.
In gold's case,
objective resistance lies about $10 above the trend-line we've drawn on
the following chart.
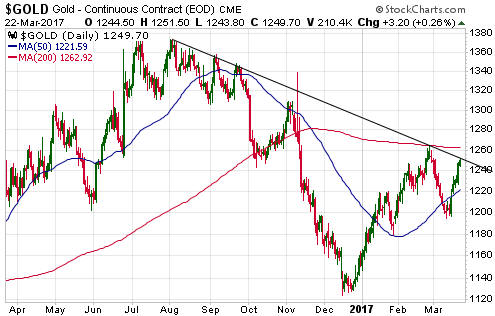
We don't view the current situation in the gold market as an
attractive selling opportunity, but the 6-day rise to subjective
resistance has created an opportunity for those -- like us -- with sizable
'long' exposure to do some hedging. We bought some additional insurance in
the form of GLD June-2016 $115 put options on Wednesday and will happily
watch these options lose most of their value if it turns out that the gold
market has more short-term upside potential than we are presently giving
it credit for.
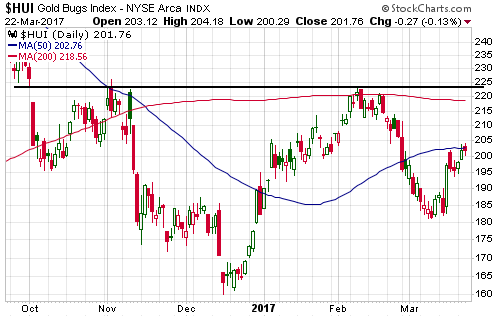
Gold Stocks
Even though the
gold price has gained about $20 since the end of last week, the HUI is
still having trouble getting past its 50-day MA. As illustrated below, it
traded above this MA on both Tuesday and Wednesday of this week but hasn't
yet been able to close above it.
Once beyond the 50-day MA it will
encounter the vastly more important resistance that extends from the
200-day MA near 218 to around 225.
Displayed below is a chart of the HUI/gold ratio. The blue line on the
chart is the 40-day MA, which for some unknown reason tends to act as
support and resistance.
Notice that the HUI/gold ratio broke
decisively below its 40-day MA in late-February. This is something that
would generally not happen during a short-term correction within an
intermediate-term upward trend. Notice, as well, that although the
HUI/gold ratio has rebounded over the past two weeks it remains
comfortably below its 40-day MA.
Needless to say, the HUI/gold
ratio must move back above its 40-day MA to suggest that the rally from
the December low was something more than a 2-month bounce within an
on-going downward trend. Until/unless it does so it will be prudent to
assume that the decline from the Q3-2016 high has not yet run its course.
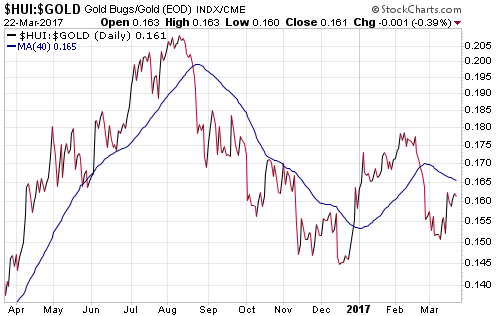
The stage is set for the gold-mining sector to make a strong move in
one direction or the other within the coming two weeks. Most of the
evidence currently indicates that the direction is more likely to be down
than up.
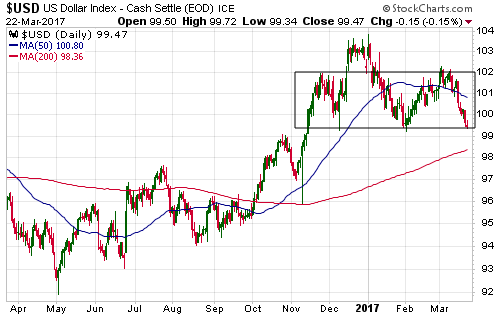
The Currency Market
The Dollar
Index is testing important lateral support at 99.5.
A spike down to
the 200-day MA, which is now at 98.3, remains a likely outcome prior to a
sustainable low. Furthermore, if such a downward spike is going to happen
at all it will probably do so within the next several trading days.
Our most recent comment on the British Pound was in the 13th March
Weekly Update, at which time we wrote:
"In terms of time, the
Pound is probably close to bottoming on a long-term basis. However, there
could be a final plunge within the next three months to create the 8-year
cycle low.
On a very short-term basis the Pound is 'oversold',
within half a point of support defined by last year's low and seemingly
poised to rebound. It could rebound as far as 125 without altering the
overall chart pattern."
As illustrated by the chart inserted
below, the Pound has rebounded as far as 125. If we are dealing with a
routine counter-trend rebound then this is about as high as it should go.
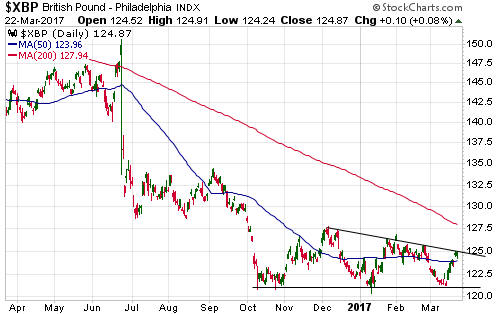
With regard to the coming 12 months, the Pound is the major currency
with the most bullish risk/reward. This is why we have converted part of
our cash reserve from US dollars to Pounds. However, we are still
expecting and hoping for an opportunity to buy the Pound below 120 during
the second quarter of this year.
If the Pound doesn't make a new
multi-year low by mid-2017 or achieves a weekly close above 129 at any
time then we will assume that the 8-year cycle low is in place.
Updates on Stock Selections
Notes: 1) To review the complete list of current TSI stock selections, logon at
http://www.speculative-investor.com/new/market_logon.asp
and then click on "Stock Selections" in the menu. When at the Stock
Selections page, click on a stock's symbol to bring-up an archive of
our comments on the stock in question. 2) The Small Stock Watch List is
located at http://www.speculative-investor.com/new/smallstockwatch.html
Chart Sources
Charts appearing in today's commentary
are courtesy of:
http://stockcharts.com/index.html
http://www.barchart.com/
![]()