![]()
![]()
![]()
![]()
- Interim Update 22nd April 2020
Copyright
Reminder
The commentaries that appear at TSI
may not be distributed, in full or in part, without our written permission.
In particular, please note that the posting of extracts from TSI commentaries
at other web sites or providing links to TSI commentaries at other web
sites (for example, at discussion boards) without our written permission
is prohibited.
We reserve the right to immediately
terminate the subscription of any TSI subscriber who distributes the TSI
commentaries without our written permission.
Relax, the Fed is going
to make everyone "whole"
Last week, a highly paid (we
assume) JP Morgan analyst opined:
"When it comes to market
developments, we believe that the Fed's action last Thursday represents a
pivotal moment in this crisis. Powell's statement included that "we will
continue to use these powers forcefully, proactively, and aggressively
until we are confident that we are solidly on the road to recovery" and
probably the most important, historic statement, "We should make them
whole. They did not cause this." This crisis is different from any other
in recent history in that it was not caused in any way by businesses or
investors. Unhindered by moral hazard, the response of fiscal and monetary
authorities is and will continue to be unprecedented, with the goal of
essentially making everyone 'whole.' We believe the significance of this
development is underestimated by markets, and this reinforces our view of
a full asset price recovery, and equity markets reaching all-time highs
next year, likely by H1. Investors with focus on negative upcoming
earnings and economic developments are effectively 'fighting the Fed,'
which was historically a losing proposition."
Well, if moral
hazard was the only thing that prevented the Fed from acting in the past
to eliminate everyone's losses, then why has the Fed never bothered to
eliminate poverty? After all, not every poor person is in that situation
due to having done something wrong. In particular, none of the children
living in poverty are to blame for their predicament.
Taking a
broader view, if it is possible for the central bank to make everyone
"whole", then why are some countries poor? These countries have central
banks that are capable of doing what the Fed is now promising to do.
The problem, of course, is that the central bank cannot add real
wealth to the economy. It cannot produce anything of real value. All it
can do is conjure money and credit out of nothing, thus setting in motion
countless exchanges of nothing for something and distorting the price
signals upon which markets rely. This is a recipe for more poverty and
generally lower living standards in the long term.
At some point
during the second half of this year, the release of pent-up demand as
restrictions are removed and people go back to work, combined with the
flood of new money generated by the Fed, could make it seem as if there
has been a 'V' bottom in the economy and that the entire recession lasted
only about four months. This could enable the SPX to return to within 10%
of its February-2020 all-time high before year-end. However, the price
distortions that have been and will be caused by the effort to make
everyone "whole" will prevent a sustainable recovery.
The deluge of
new money will boost asset prices and the prices of life's necessities,
but many businesses that closed their doors during March of 2020 will
never re-open and many people who lost their jobs will remain unemployed
(and thus dependent upon government handouts). Also, many of the people
who do end up with jobs will find that their real incomes have fallen,
because there will be an excess supply of labour and the currency's loss
of purchasing power will be reflected to the greatest extent in the prices
of things that are in relatively short supply. For the majority of people,
therefore, the post-shutdown economy will never be as good as the
pre-shutdown economy, not despite the Fed's efforts but largely because of
them.
The Oil Glut
The greatest 'long
squeeze' ever?
Normally it is only the shorts that can be
squeezed, but early this week there was a dramatic 'long squeeze' in the
oil market.
When you take a non-leveraged long position, your
maximum loss is usually 100%. The reason is that most prices can't go
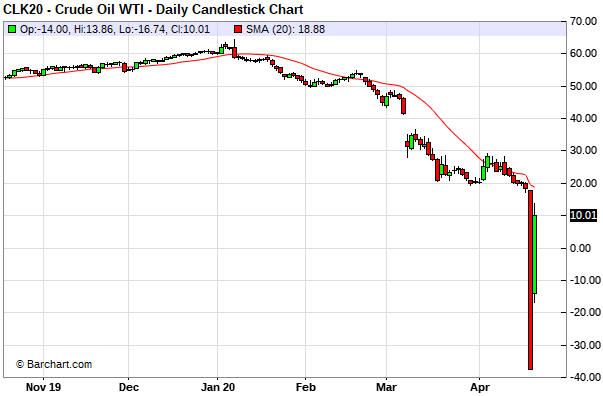
below zero. On Monday of this week, however, the price of oil for May-2020
delivery in the US futures market closed at NEGATIVE $38/barrel. It had
ended the preceding trading day at around $18/barrel, so in the space of a
single trading day the loss on a non-leveraged long position in May-2020
oil futures was more than 300%.
Here's the daily chart showing
Monday's extraordinary price collapse and Tuesday's partial recovery in
the May-2020 oil contract. Note that the contract expired on Tuesday 21st
April.
With the benefit of hindsight it isn't hard to understand how the oil
price could drop well below zero for a short period. The situation arose
because anyone still long the May contract at that time could have been
forced to take delivery, but for all intents and purposes there was no
storage space. If you have entered a contract that would require taking
immediate delivery of oil but you have nowhere to put the oil, then to
avoid being in breach you would have to pay whatever it took to get out of
the contract. On Monday 20th April, that effectively involved paying
someone as much as $38/barrel to take oil off your hands.
At this
stage only the May-2020 contract in the US oil futures market has traded
below zero. However, Monday's dramatic performance by the May contract
obviously scared speculators in later contracts, because on Tuesday the
June-2020 contract collapsed from above $20 to as low as $6.50 before
recouping part of its loss.
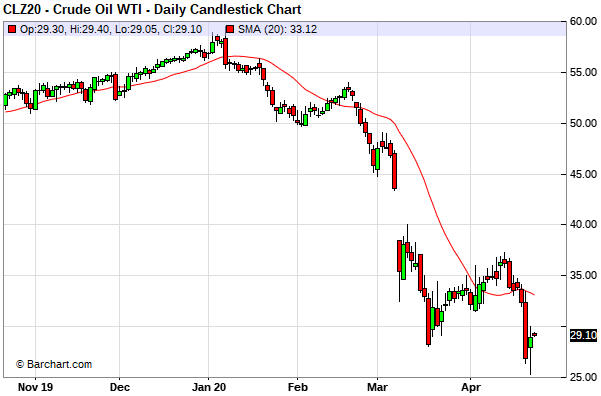
The following daily chart shows that
even the December-2020 contract, which is 6-7 months from its delivery
period, took a tumble. At the end of last week it was in the mid-$30s, but
over the first three days of this week it plunged to the mid-$20s before
rebounding to $29.
Companies that profit from the glut
Increasing
oil demand after the virus-related restrictions are removed and decreasing
oil supply in response to the low price eventually will eliminate the oil
glut. However, that likely will take at least 6 months and could take more
than a year. In the meantime, the companies that sell oil storage will
have unusually high profit margins. This includes tanker companies such as
Euronav (EURN), Frontline (FRO) and Teekay (TNK).
Rather than
transporting oil from one part of the world to another, the owners of
VLCCs (Very Large Crude Carriers -- ships that can store about 2 million
barrels of oil) can now get paid for storing oil at daily rates that are
multiples of what they were getting paid a year ago. For example, the
average daily rate for a VLCC over the past 10 years was
US$30,000-$40,000, but, thanks to the oil glut, deals are now being done
at around US$200,000/day. US$200K/day is not a sustainable rate, because
it amounts to about $3 per month ($36 per year) per barrel. However,
US$70K-$100K/day could be achievable over at least the remainder of this
year.
The upshot is that the demand for tankers is going through
the roof due to the desperate need to find somewhere to put the excess
oil, and, as a result, the companies that own tankers should generate
substantially higher earnings over the quarters ahead.
The stocks
of the large tanker companies have done relatively well this year. For
example, the following chart shows that EURN is almost flat year-to-date,
which is good compared to most stocks. However, the stock market appears
to be underestimating the earnings that these companies will deliver over
the next 12 months.
Buying tanker stocks to profit from the oil glut was described by
Harris Kupperman
as one of the best trades in decades. Kupperman discusses the trade in
some detail in the podcast at
https://www.curzioresearch.com/this-will-be-the-greatest-trade-in-decades/,
beginning at around the 22-minute mark.
It would be reasonable to
start averaging into a position in tanker stocks with the aim of holding
for 6-12 months. The upside potential over this period is at least 100%,
versus downside risk that could be limited to 20%-30% using a trailing
stop. Be aware, though, that these stocks are 'overbought' on a short-term
basis and could 'correct' with the broad market over the weeks ahead.
We are going to participate in this trade in our own account and may
add a tanker stock (probably EURN, the largest independent tanker company)
to the TSI List within the next two months.
The natural gas
cycle low, revisited
In January we wrote about the
potential for the US natural gas (NG) market to make a cycle low during
the first quarter of the year. We updated our view a week ago when we
wrote:
"The NG price didn't bottom during the first quarter,
but it's possible that a bottoming process got underway in March and that
the cycle low occurred on 2nd April. A daily close above US$2.00 would be
preliminary evidence that at least a short-term bottom is in place."
The spot NG price currently is in the $1.80s, but the following daily
chart shows that the June-2020 futures contract has edged above $2.00.
It's possible that the current up-move will be limited by the 200-day
MA in the $2.10-$2.20 range. If so, a subsequent pullback to near the
50-day MA followed by a rally that took out the April high would confirm
an upward trend reversal.
Peyto Exploration and Development
(PEY.TO), our favourite NG producer, has gained more than 150% since its
March low and has fully retraced its February-March crash. It is still a
long way below its 12-month high, but buyers near the recent low should
consider taking some money off the table. This is partly due to the risk
of a sizable short-term decline in the broad stock market.
With the
stocks of well-managed companies such as PEY, it often makes sense to
trade around a core position. This involves doing some buying during the
periodic purges and some selling during the ensuing surges, all the while
maintaining significant ('core') exposure.
The Stock Market
The S&P500 Index (SPX) reached
its 50-day MA late last week and pulled back over the first three days of
this week.
The pullback from last week's high has been too shallow to date to
confirm that a short-term top is in place and that a significant
correction is underway. Therefore, as things stand right now there is a
decent chance that the SPX will move a little higher before commencing a
meaningful decline.
We view the short-term risk/reward as decidedly
bearish, though, mainly because we perceive short-term upside potential of
no more than a few percent. Perhaps the SPX will gain enough additional
ground to achieve a solid break above its 50-day MA -- and thus get
'everyone' convinced that the old bull market has resumed -- before
beginning its next tradable move to the downside.
There is no
guarantee that it will, but if the SPX breaks above last week's high
within the next several days it will create another good opportunity to
establish bearish speculations or hedges via the vehicles mentioned in the
latest Weekly Update. Furthermore, if the SPX is able to achieve a more
solid break above its 50-day MA than it managed last Friday then it would
be reasonable to view a subsequent daily close below the 50-day MA as
evidence of a downward trend reversal.
Before leaving the US stock
market it is worth mentioning that the Dow Transportation Average (TRAN)
may again be leading to the downside. The upper section of the following
daily chart shows that TRAN's post-crash rebound peaked (to date) nine
trading days ago, and the lower section of the chart shows that the
TRAN/SPX ratio just made a new low for the year. This is evidence that an
intermediate-term trend reversal from down to up has not occurred.
Gold and the Dollar
Gold and Silver
At the end of last week, the US$ gold price (basis the June-2020
futures) was testing lateral support at $1690-$1700. The test continued
during the first two days of this week and included a spike below the
20-day MA, after which there was a sharp rise.
The fact that
support held means that nothing has changed. There is short-term downside
risk stemming from speculator positioning in the futures market, but the
fundamentals are bullish and the price action has not yet signalled a
short-term reversal from up to down.
Like the US$ gold price, the US$ silver price tested its 20-day MA on
Tuesday. However, silver's overall performance since the March low
continues to have the look of a countertrend rebound. As previously
advised, we think that silver will avoid a test of its March low, but a
decline within the next couple of months to the $13.50-$14.00 area would
not be a surprise.
Gold Stocks
The HUI closed at a new multi-year
high on Wednesday 22nd April and in doing so created the first positive
divergence between the gold sector and the bullion market -- in this case,
a higher high for the HUI in parallel with a lower high for gold -- since
last November. It was an upside breakout, but upside breakouts are not
reliable signals when they occur in markets that were stretched to the
upside prior to the breakout.
A daily close below 240 by the HUI
would signal a downward trend reversal. Until/unless that happens, trend
followers could assume that the trend is up.
20 points (about 8%)
above Wednesday's close is long-term resistance defined by the 2016 top,
which originally was our target for the intermediate-term rally that got
underway last June. Perhaps this old target will be reached within the
next few days. If so, the market will have taken a very circuitous route
to its destination.

As previously advised, we are viewing short-term strength in the gold
sector as an opportunity to do some selling/hedging. At the same time, we
recognise the sector's extraordinarily bullish fundamentals and therefore
intend to maintain substantial 'core' exposure.
Hopefully there
will be a good opportunity to remove hedges and do some new buying within
the next several weeks.
The Currency Market
There isn't much happening in the currency market, although the
short-term daily chart of the Australia dollar (A$) is comment worthy.
The following chart shows that the A$ poked its head above its 50-day
MA early last week before pulling back. This means that the A$ is in a
similar position to silver and the SPX. Each of these different markets
experienced a strong A-B-C rebound from a crash low during the third week
of March to some sort of high near the 50-day MA last week.
It isn't surprising that the A$'s performance over the past several
weeks has been similar to the SPX's performance, given that the A$ tends
to be positively correlated with global growth expectations. That silver
would be trading in synch with the A$ and the SPX is more difficult to
understand. Over the long-term silver tends to trade in synch with gold,
which is the ultimate counter-cyclical asset, but silver has an industrial
(pro-cyclical) demand component that appears to be holding sway at the
moment.
Anyway, it's a good bet that the A$ will continue to trend
up and down with the SPX over the coming month or two. This probably means
that its next significant move will be to the downside, although like the
SPX it could make a new multi-week high before reversing course.
Updates on Stock Selections
Notes: 1) To review the complete list of current TSI stock selections, logon at
http://www.speculative-investor.com/new/market_logon.asp
and then click on "Stock Selections" in the menu. When at the Stock
Selections page, click on a stock's symbol to bring-up an archive of
our comments on the stock in question. 2) The Small Stock Watch List is
located at http://www.speculative-investor.com/new/smallstockwatch.html
Chart Sources
Charts appearing in today's commentary
are courtesy of:
https://stockcharts.com/
https://www.barchart.com/
![]()