|
- 22 May, 2002
A New Era
We've devoted quite a bit of space
in previous commentaries to the gold/silver ratio and have concluded that
gold would continue to out-perform silver until either the stock market
reached a long-term bottom or the general level of commodity prices began
to trend strongly higher. This conclusion was based on historical performance
data and the recognition that gold has more of a monetary role than does
silver.
We've also looked at the relationship
between gold and platinum in the past and concluded that gold tends to
out-perform platinum during those periods when the US economy is weak and/or
confidence in the US$ is low. This conclusion was derived from historical
performance data and also makes sense on the basis that the dominant influence
on the gold price is monetary (investment) demand whereas platinum's major
uses are non-monetary.
During the 1995-2000 period the US
Dollar trended strongly higher and the US economy boomed, so the platinum
price was naturally very strong relative to the gold price. In fact, during
the final quarter of 2000 and the first quarter of 2001 the platinum price
reached its highest premium to the gold price since 1972. Of course, in
1972 gold had just been de-coupled from the US$ following 38 years of having
its price fixed at $35/ounce.
This brings us to our point. The gold
price has been persistently strong over the past 6 months, but there have
been several rallies lasting 6 months or longer since the secular
bear market in gold began in 1980. In terms of the increase in the gold
price there is certainly nothing special about the current rally. It becomes
special, however, when we note the incredible gains achieved by the gold
mining shares despite the modest-only increase in the bullion price. The
only other period over the past 40 years when gold stocks rallied to this
extent without a concurrent large increase in the gold price was during
1965-1968. As we explained in the 15 May Interim Update this 1965-1968
gold stock rally in the face of a flat gold price forewarned of the coming
gold bull market.
One of the consequences of the gold
bull market of the 1970s was that the platinum price went from being about
3-times higher than the 'fixed' gold price in 1971 to being less than 1-times
the floating gold price by late 1974.
Below is the long-term chart of the
platinum/gold ratio that we've shown in the past. Note the plunge in the
ratio from its 1971 peak and the similar-looking plunge in the ratio from
its early-2001 peak. Also note that once downward trends in the pt/gold
ratio get started they tend not to end until the ratio falls below 1.
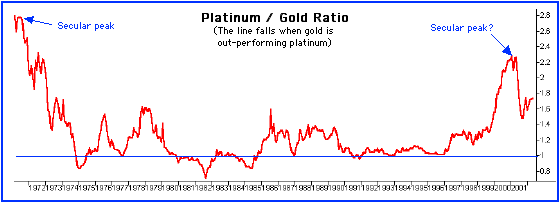
Chart Source: http://www.cairns.net.au/~sharefin/Markets/Charts/AUAG.htm#PL
So, what is our point? We actually
have two points to make (two for the price of one). Firstly, we've said
on a few occasions over the past year that we would heavily overweight
gold relative to platinum, and that remains the case. In fact, unless there
is a major and unexpected change we will overweight gold relative to platinum
until the gold price moves above the platinum price. We will, however,
still retain some exposure to the stocks of PGM producers (some of these
stocks are actually beginning to look very attractive on a valuation basis
compared to the gold and silver stocks). Secondly and more importantly,
the similarity in the way the pt/gold ratio has behaved over the past year
and the way it behaved during the early-1970s is one more shred of evidence
that we have a secular trend change on our hands, one result of which will
be a gold rally of historic proportions.
The US
Stock Market
Taking a 6-month view
There are numerous reasons to remain
bearish on the US stock market taking a 6-month view. We plan to review
these reasons in some detail in the coming Weekly Update, but in summary
and in no particular order they are:
a) Many bellwether stocks are still
trading at unreasonably-high multiples of sales
b) The money supply growth rate is
trending lower
c) Long-term interest rates are likely
to move much higher
d) Sentiment. There have been a number
of panics over the past 2 years but the majority of people have maintained
a generally optimistic outlook towards the stock market. This is not the
attitude that usually prevails at long-term bottoms.
e) The 'smart money' continues to sell
or short-sell.
Current Market Situation
The short-term forecast outlined in
the latest Weekly Update was for a pullback during the first half of this
week and then a continuation of the stock market rally until at least the
end of this month. The market has pulled back and we now have a good set-up
for a resumption of the rally. The set-up is good because:
a) During the first 3 days of this
week some sentiment indicators (eg, put/call ratios, the NYSE McClellan
Oscillator) reached levels that are consistent with what we would expect
to see at a short-term low
b) The Japanese Nikkei225 Index has
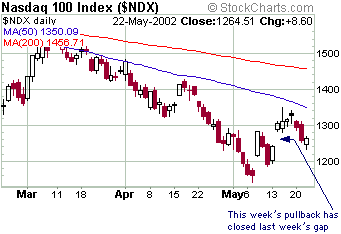
moved up to within 55 points of its high for the year
c) The upside 'gaps' that were left
by some of the major stock indices during last week's surge have now been
filled (see NASDAQ100 chart below)
Since we try to only recommend trades
at TSI that have an expected duration of at least 1 month and since we
don't have any reason to believe that a rally at this time, assuming it
does occur, will last more than 2 weeks, we are not going to recommend
any long-side trades. If the rally does unfold as expected we will consider
it to be an opportunity to buy more put options in preparation for the
ensuing decline.
Gold and
the Dollar
Current Market Situation
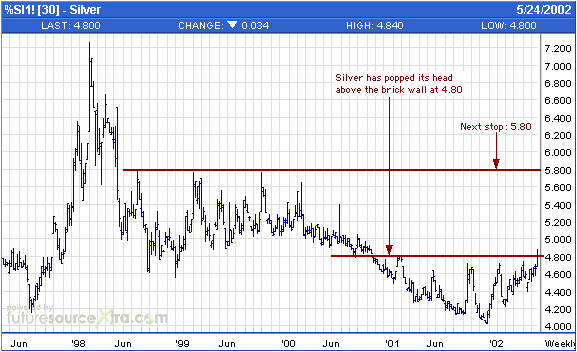
Below is a weekly chart of silver futures.
Although silver has edged above major resistance at $4.80 there has not
yet been any follow-through so there is a danger that this will turn out
to be a false breakout. False breakout or not, the move above $4.80 suggests
to us that the demand for silver is finally beginning to outweigh the supply
of silver and that the silver price will shoot higher at some point over
the next few months. There is some resistance at 5.00 and 5.40, but once
decisively above $4.80 we doubt that there will be any prolonged battle
between the bulls and the bears until $5.80 is reached.
We sold about half of our trading positions
in gold stocks in April and kept the remaining half in anticipation of
a rise in the gold price to around 320 (note: trading positions are in
addition to a core investment position in gold/silver stocks). The
spot gold price peaked at 319.30 during yesterday's trading, so is it time
to exit remaining trading positions?
It looks like a lot of traders had
a similar game plan to us since most of the major gold stocks surged during
early trading on Tuesday then reversed sharply lower as the gold price
approached 320. To take one example, Goldcorp was up by $1.30 at one point
but finished the day with a loss of $0.54 on 4-times its average daily
volume. This occurred despite the gold price holding most of its gains
to close $2 higher on the day. There is a widespread belief that the stocks
of the major gold producers are now fully priced or over-priced and that
the rally in the gold price has gone about as far as it is going to go
in the short-term. We certainly concur that the major gold stocks are,
in general, over-priced (and therefore risky for new buyers), but we are
not so sure that the gold price has reached a short-term peak.
Our previous intention to sell the
remaining trading positions as soon as the gold price rose to 320 was based
on the idea that such a rise would be in the form of a spike and would,
therefore, constitute a buying climax. However, as illustrated on the chart
included in the latest Weekly Update the gold price has been steadily moving
higher in a 'stair-step' fashion. This continues to be the case. In other
words, the recent price action in the bullion market does not indicate
that a significant peak has been reached. The gold price has just risen
for 6 days in a row so some sort of a correction should occur over the
next few days, but the odds favour new rally highs after a short and shallow
pullback.
The decline in gold stock prices that
occurs concurrently with a near-term pullback in the bullion price might
not be shallow due to the speculative premiums being sported by
most gold stocks, but we've decided to retain some trading positions in
gold stocks for now. In fact, as discussed below we are actually going
to add a gold stock (one that does not have a large speculative premium
built into its current price) to the Portfolio. We will, however, take
profits on SSRI, one of our silver stocks.
When a market is trending strongly
higher the natural tendency of most people is to focus on how much money
they will make if the trend continues. Our approach is a little different
in that we are always trying to figure out what might go wrong. A bull
market will, for a while, bail-out those who overpay for stocks, but those
who consistently overpay in the belief that someone else will overpay by
an even greater amount in the future are eventually going to lose in a
big way.
Over the past few weeks we've recommended
that new buying be focussed on the stocks of silver producers/explorers
because they hadn't been the beneficiaries of as much speculative ferver
as the gold stocks and were thus more attractively priced. There was, therefore,
less that could go wrong with these stocks (there was a greater margin
of safety). However, it is getting harder and harder to find anything to
buy since all the silver stocks we follow have rallied by 30%-50% over
the past 2 weeks. The silver price may well be on its way to $5.80, but
such a rise has already been priced into most silver stocks.
Perhaps we will need to start directing
our attention to the PGM producers as far as new buying is concerned, even
though we expect platinum and palladium to dramatically under-perform gold
over the next 12 months. At $18/share (the current stock price) a buyer
of Stillwater Mining stock (NYSE: SWC) is paying about US$26/ounce for
platinum and palladium reserves. If SWC's reserves were gold and not predominantly
palladium then its stock price would probably now be at least $60, despite
the fact that an ounce of palladium is worth around 10% more than an ounce
of gold.
By the way, the list of the 25 most
actively-traded stocks on the NASDAQ yesterday comprised 24 tech stocks
and...Durban Roodepoort Deep.
Oz Golds
Below is a monthly chart of an index
of Australian gold stocks. This chart pattern is clearly very bullish.
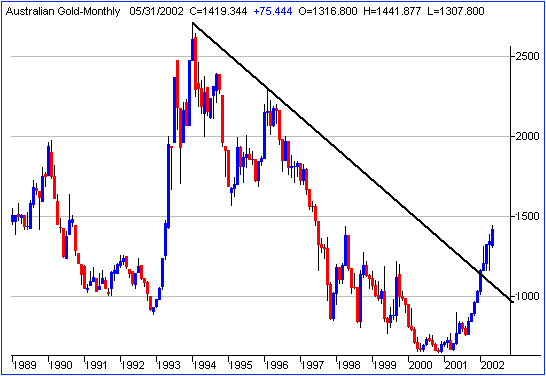
Chart Source: http://www.sharelynx.net/Markets/Charts/OZGOLD.htm
Although the Aussie gold stocks have
done very well over the past 12 months there doesn't appear to have been
anywhere near the amount of gold-stock speculation in Australia as there
has been in North America and South Africa. As such, the Oz golds will
probably make large catch-up moves at some point.
We are going to add another Australian
gold stock to the Portfolio. The name of the company is Croesus Mining
and it trades on the ASX under the symbol CRS. Croesus is producing gold
at the rate of about 300,000 ounces per year at a cash cost of US$180 and
has a market cap of US$113M at today's closing price on A$0.71. Reserves
are low, but the company has achieved a great deal of exploration success
over the past several months so the reserve problem is being addressed.
Update
on Stock Selections
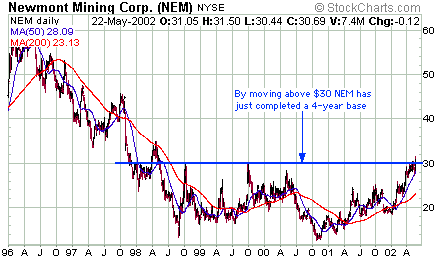
Below is a long-term chart of NEM.
NEM recently moved above a 4-year resistance line, thus providing some
more technical evidence that a major bull market is underway. If NEM pulls
back to around $28 over the next few weeks we may recommend the purchase
of some long-dated call options on this stock as a leveraged way to participate
in the coming gold-price explosion.
Pan American Silver (PAAS) is buying
our Corner Bay Silver (BAY) in an all-stock deal. Therefore, the price
of BAY will now move with the price of PAAS. The PAAS stock price is extended
from both technical (see chart below) and valuation perspectives, so traders
should take some profits now (in BAY and/or PAAS). However, since we have
decided to take profits on another one of our silver stocks (SSRI) we are
going to grit our teeth and continue to hold BAY (soon to be PAAS) in order
to retain sufficient exposure to silver.
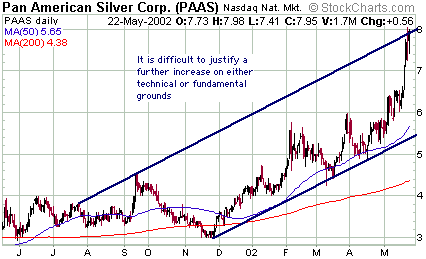
The acquisition of BAY is a good deal
for PAAS - it increases the value of each PAAS share - but as noted above
the stock price is extended and new buyers at this time are at risk of
experiencing a sharp draw-down (although current prices are probably cheap
compared to where they will be in 6 months time). From a risk/reward perspective
the best way to obtain exposure to silver at the present time is, funnily
enough, to buy silver.
CRS was added to the Portfolio at A$0.71
as discussed above. We will place an initial sell-stop at 0.56.
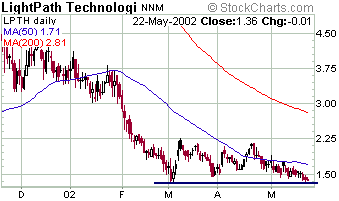
LightPath Technologies (LPTH) continues
to grind lower along with the other stocks in the optical telecommunications
sector. LPTH is unlikely to buck the trend in its sector of the market,
but it is better value and is in better financial shape than most of its
higher-profile brethren. The stock is trading below book value without
assuming any value for its intellectual property (49 US patents) and goodwill.
This, of course, doesn't mean it won't trade lower in the short-term.
As noted above, we will sell our trading
position in SSRI. The profit will be around 70%.

|
