![]()
![]()
![]()
![]()
- Interim Update 22nd July 2020
Copyright
Reminder
The commentaries that appear at TSI
may not be distributed, in full or in part, without our written permission.
In particular, please note that the posting of extracts from TSI commentaries
at other web sites or providing links to TSI commentaries at other web
sites (for example, at discussion boards) without our written permission
is prohibited.
We reserve the right to immediately
terminate the subscription of any TSI subscriber who distributes the TSI
commentaries without our written permission.
Commodities
The Emerging Copper
Shortage
There has been a spectacular rise in the copper
price from its March-2020 low. In fact, after trading at a 4-year low and
coming close to trading at a 10-year low in March, the copper price is now
close to a 2-year high and is comfortably above the level at which it
ended last year. It's just as well that central banks aren't able to
counteract the powerful deflationary forces in the world. Imagine how fast
the copper price would have risen if they could*.
Speculation has played a role in the copper rally of the past four
months. This is evidenced by speculators in Comex copper futures having
gone from being net-short by about 40K contracts near the March-2020 price
low to being net-long by about 40K contracts today. However, speculator
buying is being driven by the legitimate concern that the supply situation
in the copper market is tightening.
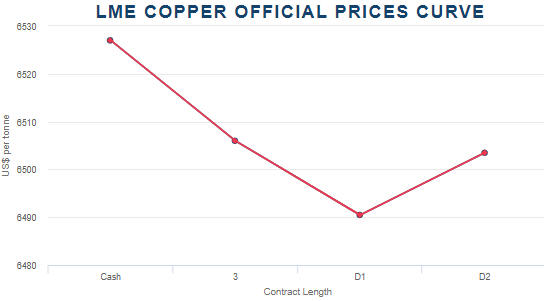
The evidence that supply is
tightening in the copper market includes the following chart from the
London Metal Exchange (LME) web site. This chart shows that the spot
copper price is above the 3-month price and that the 3-month price is
above the December-2021 price, that is, it shows that the copper market is
in backwardation. This is an unusual circumstance that points to the
current supply of the physical commodity being low relative to the current
demand.
The evidence also includes the social distancing measures that have
been implemented at copper mines throughout Chile, where about 30% of the
world's copper is produced. Over the past few months the large Chilean
copper mines have managed to sustain production at their pre-COVID levels
and in some cases have even increased production by a small amount,
despite having smaller workforces due to the need for social distancing.
This was made possible by NOT doing routine maintenance. The general
failure to do maintenance work during Q2-Q3 of this year should result in
lower production at the world's largest copper mines late this year and
during the first half of next year.
We remain intermediate-term
bullish on copper, but we expect a sizable pre-election correction.
*Hopefully the sarcasm is obvious.
The Platinum Breakout
In the 1st July Interim
Update we reiterated our view that the platinum price was in the early
stages of a cyclical advance driven by reduced mine supply, massive
monetary inflation and the metal's low relative valuation. We also
mentioned that it might have just completed a short-term correction.
The platinum price has since risen from the US$830s to the US$950s and
in doing so has broken above an obvious lateral resistance level.
Breaks above obvious resistance levels aren't reliable indicators of
future performance. Consequently, we almost never buy immediately after an
upside breakout. Instead, we prefer to buy pullbacks to support and view
upside breakouts as the reward for having had the good sense and fortitude
to buy the preceding weakness.
The Stock Market
Unprecedented
We've had to use the word "unprecedented" an unprecedented number of
times over the past five months.
The following chart of the
Chicago Fed's National Activity Index (CFNAI) illustrates the extent to
which the recent past deviates from the norm. The CFNAI is a composite of
85 monthly indicators and is constructed so a zero value equates to the US
economy growing at its historical trend rate. Negative values indicate
below-average growth and positive values indicate above-average growth.
When the government locks-down the bulk of the economy, naturally
there's a collapse in economic activity. When the government then showers
the populace with money, naturally the initial result is a dramatic
increase in economic activity (since the negative effects of rampant money
creation and deficit spending come much later). These actions have pushed
many economic indicators into uncharted territory.
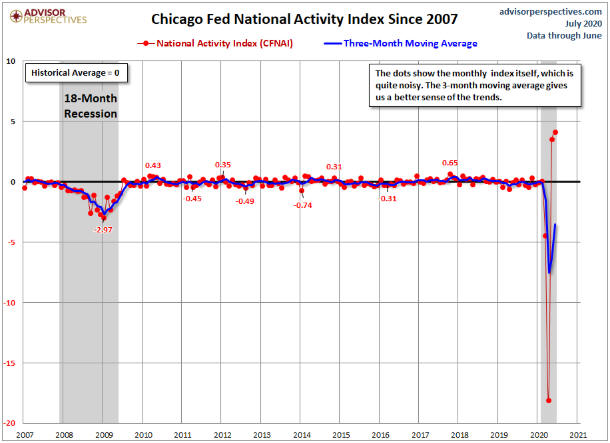
Source:
dshort
Strange bedfellows: The mega-cap tech stocks and
the gold miners
The following chart shows that since the
beginning of the 'coronacrisis' there has been a strong positive
correlation between the NASDAQ100 Index (NDX) and the gold mining sector
(represented on the chart by the HUI). At first glance this seems
downright weird, but there is a reasonable explanation for the
correlation.
The explanation is that the lockdowns didn't hurt, and in some cases
even boosted, the prospects of the mega-cap tech stocks (e.g., Amazon,
Microsoft, Alphabet (Google), Facebook, Apple, Netflix) that dominate the
NDX. The economic disarray caused by the lockdowns and the ensuing efforts
to mitigate the short-term economic pain also boosted the prospects and
therefore the investment appeal of companies that mine gold.
We
suspect that the positive correlation between the NDX and the HUI will be
maintained for at least three more months, with both reaching important
tops within the next several weeks and then 'correcting' together.
Current Market Situation
The S&P500 Index (SPX)
has edged above its early-June high to a new 5-month high. It is up on the
year and less than 4% below its all-time high, so everything must be fine.
Obviously everything is not fine, but money supply matters.
It's
interesting that the NYSE Advance-Decline Line (ADL), which is shown in
the lower section of the following chart, didn't confirm this week's new
multi-month SPX high. The non-confirmation will be significant (bearish)
if it persists.
In essence, what the US stock market is showing is the effect of
currency depreciation. This time around the effect won't be limited to the
financial markets, however, because although the Fed is busily monetising
bonds, the government is busily ensuring that a lot of money goes to the
general public. As a result, over the next 12 months the effects of the
monetary inflation should be most obvious in the prices of commodities,
goods and services. If so, there will be downward pressure on
price/earnings (P/E) ratios in the stock market, leading to relatively
poor performance by the 'growth' stocks that are dominating at the moment.
In a nutshell, "stagflation", which is coming soon if it isn't here
already, leads to lower growth premiums and generally lower valuations in
the stock market. The stocks of commodity producers and other companies
that profit from the "inflation" should do well, but that's because of a
rising 'E' not a rising 'P/E'.
An implication is that the Fed's
ability to boost the stock market's valuation may have run its course.
That could be why the SPX's performance has been laboured since
early-June. It isn't going down, but it is struggling to make additional
headway.
We continue to think that the short-term risk/reward is
bearish for the senior US stock indices, but with sentiment remaining
mixed it's possible that the market will hold up for a few more weeks.
Gold and the Dollar
Gold
In
the latest Weekly Update we wrote that gold's recent price action had the
look of a consolidation within a short-term upward trend, the implication
being that an extension of the short-term upward trend was likely. Over
the past two days the US$ gold price broke above its early-July high to
new multi-year highs, so we are getting the expected extension.
Unlike the silver market (discussed below), the gold market isn't immersed
in an upside blow-off. At least, it isn't yet. Therefore, at this stage
there isn't a reason to expect anything more bearish than a routine
short-term correction in the gold market.
Silver
Silver took off like a scalded cat over
the past few days. We mentioned in the latest Weekly Update that a test of
long-term resistance in the $21-$22 area, or about $2 above last week's
close, was possible prior to the next substantial correction. The price
surged to this resistance area on Tuesday and blew past it on Wednesday.
With resistance in the low-$20s having been overcome, how high can the
price go before it reaches a multi-month top?
In situations such as
this, the 'when' question (what is the likely time of the top?) is a lot
easier to answer than the 'where' question (what is the likely price level
of the top?). The answer to the 'when' question is: Soon. Due to the
silver market having entered upside blow-off mode, the next multi-month
top could occur as early as this week and should occur before the end of
next week.
When silver tops it usually doesn't leave us guessing
for long. The tops that follow rapid rises usually are signalled by either
a large single-day price decline or a dramatic intra-day price reversal.
Gold Stocks
The gold mining sector
(represented on the following daily chart by the HUI) has extended its
upward trend and is now slightly 'overbought'. Like gold and unlike
silver, it isn't immersed in an upside blow-off, so at this stage there
isn't a reason to expect anything more bearish than a routine short-term
correction.
Further to the discussion in last week's Interim Update, it continues
to look like the gold sector is headed for a multi-month top between
early-August and early-September. If a 2-3 week correction begins within
the next few days then the scales will tip in favour of an early-September
peak, but if the market presses higher with only 1-2 day interruptions to
the advance then an earlier peak will be likely.
The
Currency Market
The Dollar Index
(DX) tests critical support
The DX extended its decline over
the first three days of this week and is now testing support defined by
its March-2020 low. This support is critical, because a monthly close
below it would remove almost all remaining doubt that the US$ has
commenced a cyclical bear market.
We expect that the DX will
rebound soon and therefore avoid a solid break below its March-2020 low
for now. However, a downside breakout is likely within the next few
months.
The euro has taken out its March-2020 extreme already, but, as is the
case with the DX, confirmation requires a monthly close beyond the March
extreme and that might have to wait until later this year.
The Canadian dollar (C$) versus the
Australian dollar (A$)
Over the past few months we have
devoted a fair amount of commentary space to explaining and reiterating
our 1-2 year bullish outlook for the A$, but we have said very little
about the other senior commodity currency (the C$). Our most recent
comment about the C$ was in the 1st July Interim Update, when we repeated
our view that the A$ would have an upward bias over the coming 1-2 years
and mentioned that the C$ also should do well, albeit not as well as the
A$.
In the 13th July Weekly Update we listed five reasons to expect
a major rally in the A$ over the coming 1-2 years, the most important of
which was/is the coming rise in commodity prices. This is bullish for the
A$ due to the strong positive correlation between this currency and the
general commodity-price level. It is bullish for the C$ for the same
reason.
The positive correlation between the C$ and the S&P Spot
Commodity Index (GNX) is clearly evident on the following chart.
We expect that both the A$ and the C$ will be elevated by a cyclical
bull market in commodities, but why is it likely that the A$ will
outperform the C$?
The main reason is that the C$ tends to be weak
relative to the A$ during multi-year periods when the Dollar Index is
weak. This is probably because of the closeness of the Canadian and US
economies.
The following chart compares the C$/A$ exchange rate
with the Dollar Index (DX) and illustrates the point we are trying to
make. The chart shows that there isn't a reliable relationship in the
short-term, but the big trends in the C$/A$ rate tend to be the same as
the big trends in the DX. If the DX has commenced a big trend to the
downside, then so, in all likelihood, has the C$ relative to the A$.
Trends in the exchange rates of the major currencies are
self-limiting. This is because both extreme currency strength and extreme
currency weakness prompt central bank and government intervention designed
to stop the trend. Consequently, even if our analysis is totally correct
there are limits to how strong we should expect the A$ to become.
Based on what happened over the past two decades, the downside limit for
C$/A$ appears to be in the low-to-mid 0.90s. In other words, the A$ could
trade 5%-8% above the C$ before the current cycle is over, but it isn't
reasonable to expect much more than that.
Updates on Stock Selections
Notes: 1) To review the complete list of current TSI stock selections, logon at
http://www.speculative-investor.com/new/market_logon.asp
and then click on "Stock Selections" in the menu. When at the Stock
Selections page, click on a stock's symbol to bring-up an archive of
our comments on the stock in question. 2) The Small Stock Watch List is
located at http://www.speculative-investor.com/new/smallstockwatch.html
![]() Alkane
Resources (ALK.AX) began trading 'ex' the Australian Strategic
Materials (ASM) spinout on 21st July. The stock opened A$0.06 lower and
then recovered to end the day unchanged, which could mean that the market
is valuing ASM at A$0.30/share (5 times 0.06, since initially there will
be one ASM share for every five ALK shares) and that subsequently there
was sufficient strength in the gold mining sector to offset the effect of
the ASM distribution.
Alkane
Resources (ALK.AX) began trading 'ex' the Australian Strategic
Materials (ASM) spinout on 21st July. The stock opened A$0.06 lower and
then recovered to end the day unchanged, which could mean that the market
is valuing ASM at A$0.30/share (5 times 0.06, since initially there will
be one ASM share for every five ALK shares) and that subsequently there
was sufficient strength in the gold mining sector to offset the effect of
the ASM distribution.
We won't know until after ASM shares begin
trading on 30th July. What we do know is that A$0.30/share would equate to
a market cap of about A$36M for ASM, which would be very low given the
potential value of ASM's Dubbo Specialty Metals project. We almost
certainly will be buyers of ASM shares on the market if they are available
near A$0.30 when listed on 30th July.
We have added ASM to the
"Trading Positions" section of the TSI List assuming an initial price of
A$0.30 and an effective dividend to ALK shareholders of A$0.06/share.
However, we'll adjust the initial ASM price (and the associated ALK
dividend amount) if ASM doesn't trade close to this level at some point
during its first few days as a listed company.
Also, we have
removed ALK from the TSI List. The reason is that the stock is now trading
well above our estimate of fair value. The company potentially will grow
into its current valuation due to drilling success at the Boda target and
expansion of the Tomingley Gold Operation, but at this time the
intermediate-term risk/reward is not sufficiently attractive.
The
stock is up by about 120% since the beginning of this year and more than
500% since its inclusion in the TSI List back in 2016. Along the way there
have been many buying and selling opportunities. ALK served us well.
 We had planned to add Resolute Mining (RSG.AX), a
mid-tier gold producer with mines in West Africa, to the TSI List as a
trading position in today's report, but on Wednesday 22nd July the stock
price broke upward from a basing pattern and gained 13%. This has worsened
the short-term risk/reward by enough to prevent us from 'pulling the
trigger'. However, we will add RSG to the TSI List if it trades at A$1.26
within the next two weeks.
We had planned to add Resolute Mining (RSG.AX), a
mid-tier gold producer with mines in West Africa, to the TSI List as a
trading position in today's report, but on Wednesday 22nd July the stock
price broke upward from a basing pattern and gained 13%. This has worsened
the short-term risk/reward by enough to prevent us from 'pulling the
trigger'. However, we will add RSG to the TSI List if it trades at A$1.26
within the next two weeks.
Chart Sources
Charts appearing in today's commentary
are courtesy of:
https://stockcharts.com/
https://www.lme.com/
http://bigcharts.marketwatch.com/
![]()