![]()
![]()
![]()
![]()
- Interim Update 22nd August 2018
Copyright
Reminder
The commentaries that appear at TSI
may not be distributed, in full or in part, without our written permission.
In particular, please note that the posting of extracts from TSI commentaries
at other web sites or providing links to TSI commentaries at other web
sites (for example, at discussion boards) without our written permission
is prohibited.
We reserve the right to immediately
terminate the subscription of any TSI subscriber who distributes the TSI
commentaries without our written permission.
The Fed becomes more
worried
Comments from senior Federal
Reserve officials indicate that the Fed is becoming increasingly worried
about the possibility of the US yield curve inverting. Of particular
relevance, a few of the FOMC's voting members apparently believe that an
inversion of the yield curve is a cause of recession and that a recession
can be avoided by preventing the inversion. This is akin to believing that
a high reading on a thermometer causes a fever and that fever can be
prevented by tampering with the thermometer.
Due to the Fed's
concerns about yield curve inversion there's a good chance that there will
be just one more official US rate hike this year as opposed to the two
rate hikes that the financial markets are presently expecting (the Fed
Funds futures market is saying that a September rate hike is a done deal
and that there is a roughly 60% chance of a December rate hike).
Furthermore and as mentioned in previous TSI commentaries, if the Fed
starts taking actions designed to steepen the yield curve at this point of
the business cycle a potential effect will be an inflationary blow-off in
2019-2020.
The more the Fed worries about the consequences of an
inverted yield curve now, the greater the risk of a major inflation scare
over the coming 1-2 years.
Lithium
The risk of over-supply
Lithium is the primary EV (Electric Vehicle) battery metal. Regardless
of the changes to battery design it's a near certainty that for at least
the next 5 years almost all the batteries that go into EVs will contain
some lithium. However, there is no lithium exposure in the TSI List. This
is mainly because there appears to be substantial scope to increase the
supply of lithium from operations in politically-stable countries to meet
the rapidly-increasing demand from the EV industry.
The abundance
of lithium supply was highlighted in a
recent presentation by a senior executive of SQM, one of the world's
two largest lithium producers. The presentation noted that a) SQM's own
reserves were enough to cover 200 years of global lithium demand at the
2017 level, b) SQM plans to increase the annual lithium supply from its
Atacama salt flats operation in Chile from 48,000 tonnes to 180,000 tonnes
in three years, and c) the market could be massively over-supplied by
2022, with annual production of 735K tonnes versus demand of only 475K
tonnes.
Now, there's a distinct possibility that SQM is
deliberately overstating the amount of future supply in an effort to
discourage new entrants to the market and make it more difficult for
potential competitors to get financing. Also, we suspect that the EV
production forecasts that are being used to estimate the future demand for
lithium and other battery metals are hugely underestimating the pace at
which EVs will be adopted. However, it appears that the supply of lithium
is far more elastic than the supplies of cobalt, the rare-earth metals
that are used to make the magnets that go into electric motors, and even
nickel.
A commodity bull market can occur in the face of an elastic
supply situation, especially when supply is dominated by a small number of
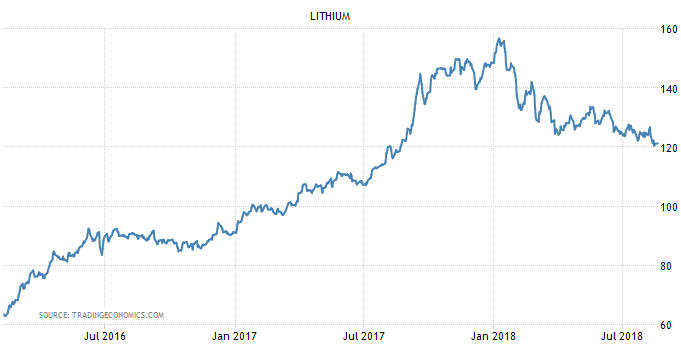
large producers and future demand is being widely underestimated. Last
decade's iron-ore bull market is a good example. Furthermore, up until now
the relative abundance of lithium hasn't adversely affected its price
performance in a big way. Instead, the lithium price chart (see below)
looks similar to the price charts of other EV Metals, with a run-up to an
early-2018 high followed by a substantial correction.
We therefore
don't view the lithium market's strong supply-growth potential as a deal
breaker.
A lithium investment worth considering
If we
were going to speculate in junior lithium stocks, at current prices we
would opt for Kidman Resources (KDR.AX, recent price A$1.13) and/or
Advantage Lithium (AAL.V, recent price C$0.80). KDR is working with SQM to
develop the Mt Holland hard-rock lithium project in Western Australia into
a 40Kt/year operation. AAL is working with Orocobre, a mid-tier lithium
producer, to develop the Cauchari lithium brine project in Argentina into
a 20Kt/year operation. Both companies are potential takeover candidates,
with their respective JV partners being the most likely acquirers.
But rather than obtain leveraged exposure to lithium via speculations in
junior mining companies, at this time we would prefer less leverage and a
lot more safety via a company that is profitable, financially-solid and
dividend-paying. The company is Mineral Resources Ltd. (ASX: MIN).
MIN has a market cap of A$2.8B at A$15.00/share. At this price it is
trading at slightly more than 10-times last year's earnings and has a
dividend yield of 4.3%. Also, its earnings are growing at a decent pace
(35% over the past 12 months) and it has a healthy balance sheet with
$175M of long-term debt offset by $148M of working capital.
MIN is
first and foremost a mining services company operating in Western
Australia, providing pit-to-port service for customers that include Rio
Tinto, BHP, Newmont Mining and Barrick Gold. More specifically, MIN does
everything from building the mine and processing plant to operating the
mine/plant to transporting the processed material via road or rail to the
shipping port to handling the material at the port.
The company
also takes part ownership of exploration-stage projects that it helps to
finance through to production. In most cases its aim is to end up with a
life-of-mine service contract and to sell down its equity stake in the
mine, but it has retained ownership stakes in some projects. These
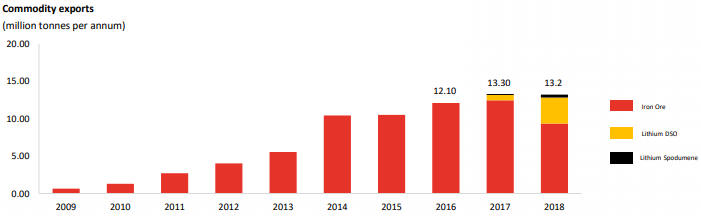
projects provide direct exposure to the prices of iron-ore and lithium.
Two years ago MIN's direct commodity-price exposure was 100% iron-ore,
but via its ownership stakes in the Wodgina and Mt Marion lithium projects
it is now one of the world's largest owners of hard-rock lithium units and
has significant lithium production. Moreover, the following chart shows
that its lithium production is growing rapidly as a percentage of its
total commodity production.
As illustrated by the following daily chart, MIN's stock price peaked
at around A$22 early this year and hit a year-to-date low near A$14 last
week. Last week's low coincided with strong chart-based support and could
turn out to be the low for the year, although a lot will depend on what
happens to the commodity markets.
MIN has been added to the TSI List at today's price of A$15.00 on the
expectation that it will return to its early-2018 high within the next 12
months and move much higher over the long term.
Note that buyers of
the stock before 31st August will be entitled to the A$0.40/share final
dividend.
The Stock Market
The S&P500 Index (SPX) moved up
to its January-2018 all-time high early this week. It ended Wednesday's
session about 10 points below this level, so a breakout could happen
within the coming few days.
The SPX has performed similarly this
year to date to how it performed in 2000 -- the year it completed a
long-term upward trend and rolled over into a bear market that ultimately
cut its price in half. In both years there was a surge to an all-time high
early in the year followed by a plunge and then a choppy multi-month
rebound back to near the all-time high. In 2000 the SPX embarked on a
major decline after testing its Q1 peak, with the start of the major
decline being signaled by a break below the channel bottom in
mid-September.
The upper sections of the following charts show the
similar price patterns. To keep to the 2000 pattern, the SPX will have to
reverse course from near its current level and break below its channel
bottom.
However, the lower sections of the following charts reveal
an important difference between 2000 and 2018. In 2000 there was a blatant
bearish divergence between the SPX and the NYSE Advance-Decline Line (ADL)
at the Q1 peak and then sideways movement in the ADL during the rebound
that led to a test of the SPX's peak, whereas in 2018 there has been no
bearish divergence between the SPX and the NYSE ADL. In fact, there has
been a bullish divergence, with the ADL trending upward throughout this
year to date.
The next chart shows that the topping pattern that preceded the
2007-2009 bear market also involved a bearish divergence between the SPX
and the NYSE ADL.
The current lack of a bearish divergence between the SPX and the NYSE
ADL doesn't mean that a sharp decline won't get underway soon. After all,
the Q1-2018 plunge began in the absence of any bearish divergence between
market internals and the SPX. What it means is that if a sizable decline
gets underway in the near future it will be another bull-market
correction, not the first leg of a bear market.
The most reliable
and timely sign that a sizable decline has begun will be a daily SPX close
below its channel bottom.
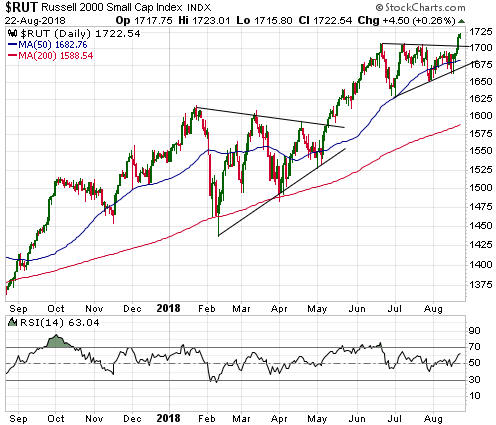
None of the senior US stock indices broke
out to the upside over the first three days of this week, but the
Russell2000 SmallCap Index (RUT) certainly did. At this time there's no
way of knowing whether the RUT's breakout will lead to significant
additional gains or a quick failure, but the breakout is a signal to exit
short-term bearish speculations linked to this index.
There is an
IWM (Russell2000 ETF) September-2018 put option in the TSI List. This
option position is down by 80% so selling now doesn't salvage much value,
but the price action suggests that the position should be exited
nonetheless. A new position with a later expiry date could always be
entered if subsequent price action proved that this week's breakout was a
'fakeout'.
Gold and the Dollar
Gold
The
Consensus-inc Bullish Sentiment Index
for gold hit a new 10-year low of 23% at the end of last week. During the
2002-2018 period it was lower on one occasion only -- when it reached 22%
in May-2004. Therefore, it is similar to the net speculative position in
Comex gold futures in that it is pointing to a negativity extreme.
However, it is also similar to the net speculative position in that the
current sentiment situation only counts as extreme in relation to what
happened since 2001. The following chart shows that over the preceding two
decades there were plenty of occasions when sentiment was more bearish. In
fact, during the 1980s there were several occasions when the Consensus-inc
Bullish Sentiment Index dropped to single digits.
So, will the current preponderance of pessimism about gold's prospects
enable a strong gold rally over the months ahead?
It certainly
helps, because it means that there is plenty of scope for speculators to
be recruited to the long side of the gold market after the price action
signals a reversal and/or after the fundamental backdrop shifts in gold's
favour.
Currently, we have is a gold market that is very 'oversold'
with the sort of sentiment that is often associated with an important
price low, but a market that is yet to signal that a sustainable low is in
place. As mentioned in each of the past two TSI commentaries, the first
sign would be a daily close above $1210 or the 20-day MA, whichever is
lower.
The following daily chart shows that the US$ gold price has
rebounded from last Thursday's low of $1167 to slightly below initial
resistance at $1210-$1211. Therefore, the first sign that a sustainable
low is in place has not yet appeared. This means that there is a high risk
of a decline to a new 12-month low prior to the start of a meaningful
rally.
Gold Stocks
Remarkably, the HUI has managed to
rise for four days in a row without moving outside last Thursday's trading
range. The weakness of this rebound suggests that there will be a decline
to below last Thursday's low prior to the start of a rally worth trading.
Unfortunately, there is no nearby resistance level that the HUI or GDX
could exceed to generate a high-confidence signal that a sustainable low
is in place. Instead, for both the HUI and GDX the first significant
resistance is about 10% above the current price. The resistance levels we
are referring to are 160 for the HUI and $21.00 for GDX. However, the
bottom of the decline could be signaled by a plunge below last week's low
followed in quick time by an upward reversal.
From our perspective,
the biggest challenge posed by the current situation is that the
gold-mining sector has done nothing to signal that a sustainable low is in
place and at the same time is too 'oversold' to justify re-establishing a
put-option hedge (insurance) position. Some additional consolidation over
the coming week or so could create a new opportunity to hedge, while a
bottom could be signaled by either a surge or a plunge.
The
Currency Market
The Dollar Index
(DX)
In the latest Weekly Update, we wrote: "Based on
sentiment indicators, we expect that the DX's next multi-month top will be
in place by mid-September. That's regardless of whether or not the
fundamental backdrop remains US$-bullish. Also, although the odds are in
favour of additional gains prior to a multi-month top, a daily close below
95.5 during this week would be a preliminary warning that such a top was
already in place."
As illustrated below, the DX dropped by
enough over the past two trading days to generate the above-mentioned
preliminary warning that a multi-month top is in place.
The DX's weakness over the past two days was ostensibly due to Donald
Trump. First, Trump again publicly chastised the Fed for hiking interest
rates. Second, there is concern that this week's convictions of two of his
former close associates will lead to legal problems for the President.
However, while the fundamental backdrop remains supportive for the DX on
an intermediate-term basis, the following chart shows that on a short-term
basis the DX's pullback from last week's high was consistent with a
reduction in the US-Germany 10-year yield spread.
As noted in the latest Weekly Update, the next piece of important
evidence will be the DX's August monthly close. It has to end August above
95.1 to confirm the recent upside breakout at the weekly level.
The Swiss Franc (SF)
The SF is close to completing
a base that incorporates a double bottom in May and July. From a bull's
perspective, the ideal would be for the SF to spend a few days
consolidating in the 101.5-102.0 range and then complete the base via a
solid close above 102.0.
Also, of the major currencies the SF continues to have the most
supportive COT situation. Of particular significance, last week's COT
report showed that, despite the SF's recent constructive price action, the
total speculative net-short position remained near a 10-year high and the
'dumb money' (NonReportable traders) net-short position remained near an
all-time high. This means that there is plenty of 'sentiment fuel' to
power a Swiss Franc rally.
Updates on Stock Selections
Notes: 1) To review the complete list of current TSI stock selections, logon at
http://www.speculative-investor.com/new/market_logon.asp
and then click on "Stock Selections" in the menu. When at the Stock
Selections page, click on a stock's symbol to bring-up an archive of
our comments on the stock in question. 2) The Small Stock Watch List is
located at http://www.speculative-investor.com/new/smallstockwatch.html
Chart Sources
Charts appearing in today's commentary
are courtesy of:
https://stockcharts.com/
https://tradingeconomics.com/
http://bigcharts.marketwatch.com/
![]()