![]()
![]()
![]()
![]()
- Interim Update 22nd November 2017
Copyright
Reminder
The commentaries that appear at TSI
may not be distributed, in full or in part, without our written permission.
In particular, please note that the posting of extracts from TSI commentaries
at other web sites or providing links to TSI commentaries at other web
sites (for example, at discussion boards) without our written permission
is prohibited.
We reserve the right to immediately
terminate the subscription of any TSI subscriber who distributes the TSI
commentaries without our written permission.
Another Uranium Update
There's a lot happening in the
uranium sector and therefore another brief update is warranted, although
the main purpose of today's uranium commentary is to address an error in
the latest Weekly Update.
In the Weekly Update, we wrote: "Despite
the market for physical uranium remaining moribund and the uranium price
remaining near $20/pound, uranium mining equities continue to catch a bid.
In doing so they are continuing to follow a path that is very similar to
the one taken at around this time last year." The data source we were
using hadn't updated the uranium price for more than a week and so we
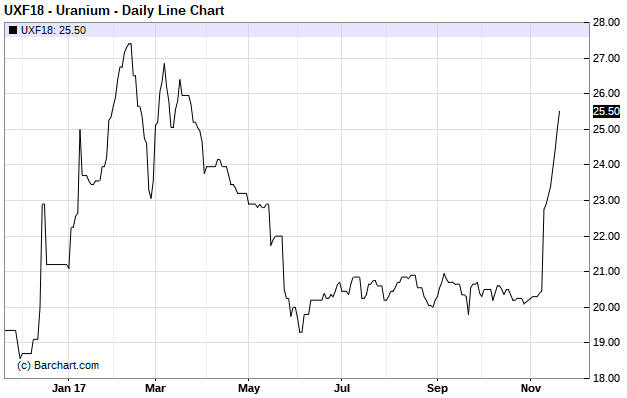
missed the fact that there had been a significant bounce. Based on the
January-2018 uranium futures contract, a daily chart of which is presented
below, the uranium price ended last week at $25.00 following a quick-fire
rally of more than 20% over the preceding days. As a consequence, the
premium to net asset value at which the Uranium Participation Fund (U.TO)
was trading was nowhere near as large as we thought*.
The recent
sharp rise in the uranium price actually increases the similarity between
this year and last year, although this year's surge started about a month
earlier than last year's.
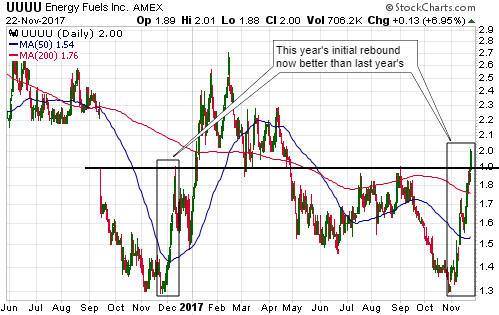
In the Weekly Update we revisited the similarity between the
performance of Energy Fuels (UUUU) during the final two months of last
year and its performance since this year's late-October bottom. We wrote:
"If UUUU continues to follow a similar path to last year then it will
soon peak near US$1.90, after which it will pull back to the vicinity of
its 50-day MA in the low-$1.50s before surging anew."
Despite
the price of the January-2018 uranium futures contract pulling back from
$26 on Tuesday to $24.50 at the close of trading on Wednesday 22nd
November, UUUU broke through resistance at US$1.90 on Wednesday in
sympathy with another sharp sector-wide rise in uranium-mining share
prices. As a consequence, the initial rebound from the low is now even
stronger this year than it was last year. However, a correction to the
50-day MA could still happen.
We don't know that a decline to the 50-day MA will occur over the
weeks ahead. What we do know is that a decline to the vicinity of the
50-day MA for UUUU and most other uranium stocks will be required to
create the second good set-up for new buying, the first having been
created by the late-October plunge to support defined by last year's low.
*We wrote that the premium was about 28%, but
it was probably 8%-10% then and is probably about 13% now. 13% is too
high, but it isn't ridiculous.
Collapsing
Stories
A few weeks ago we discussed the
extraordinary enthusiasm for story stocks. These are stocks that have
attracted massive demand based on an interesting story and have been bid
up to the point where the stock price bears no resemblance to what the
underlying business is currently worth. In some cases the underlying
business will develop in a way that justifies the stock price, but in the
vast majority of cases the stock price will eventually collapse.
The prices of two of the story stocks given as examples in our earlier
discussion have recently collapsed, although their stock-market valuations
are still absurdly high relative to the companies' assets. We are
referring to Garibaldi Resources (GGI.V) and HIVE Blockchain Technologies
(HIVE.V). As illustrated by the following daily charts, GGI's stock price
has dropped by more than 50% over the past 3 trading days and HIVE is down
by more than 50% from the high that was reached 14 trading days ago.
Of these two stocks, HIVE has less remaining downside risk. As long as
the 'crypto mania' continues, HIVE's cryptocurrency-mining datacentres
will have significant value. GGI's exploration-stage base-metal assets,
however, are possibly worthless under any conditions.
The Stock Market
The bull market is
valuation driven
Recently there has been a lot of talk in
the financial press about the equity bull market being earnings-driven,
but this is only true if you don't look back further than the past 9
months. In reality, the bullish trend has been primarily driven by
valuation, meaning that the main driver of higher prices has been a rising
market-wide price/earnings (P/E) ratio.
As evidence we present the
following chart of the S&P500's P/E ratio. This chart shows that the P/E
ratio has risen from a low of 13 in October-2011 to a current level of
24.7. This is a 90% increase. Over the same period the S&P500 Index (SPX)
rose from 1100 to 2600, or by 136%. The implication is that two-thirds of
the gain in the SPX from its October-2011 bottom has been due to investors
being prepared to pay a higher earnings multiple for stocks. To put it
another way, in terms of effect on share prices the willingness of
investors to pay a higher multiple of earnings for the same shares has
been twice as important as earnings growth.
Like almost everything else in the financial markets, the P/E ratio
doesn't go up or down in a straight line. It therefore isn't surprising
that the major upward trend in the P/E ratio that began back in October of
2011 contains numerous pullbacks, including a pullback over the past two
quarters. The pullbacks can be caused by a falling SPX or rising earnings.
The most recent pullback was caused by rising earnings, with the most
significant earnings improvement happening in the energy sector.
That the current bull market has been valuation-driven is not in any way
abnormal. The fact is that all long-term equity bull markets are
valuation-driven. In other words, for the most part equity bull markets
are NOT about earnings growth; they are about people being prepared to pay
more for a dollar of earnings.
The most unusual aspect of the
current long-term equity bull is that it began at a medium valuation
rather than a low valuation. It therefore reached 'over-valuation
territory' quite early in its life, but this didn't stop it or even slow
it down.
Current Market Situation
The
dip-buyers remain in control in the US stock market and last week's
tentative bearish signal was quickly negated. There is a litany of reasons
to be concerned that a 10%-20% down-move will soon begin, but the price
action has not yet signaled a reversal.
Turning to Europe, a week
ago we wrote:
"The EURO STOXX 50 Index (STOX5E), the European
equivalent of the Dow Industrials Index, has just dropped for 8 days in a
row and suffered a quick peak-to-trough decline of about 5%. There's a
good chance of a rebound over the next few days, but it's likely that the
2017 peak is in place and that a 1-3 month (or longer) correction is
underway."
The expected rebound began immediately and may have
already run its course.
Gold and the Dollar
Gold
The
gold market has experienced strange price action over the past several
days. There has been the greatest intra-day volatility in months and minor
breakouts in both directions with no follow-through in either direction.
In particular:
1) There were intra-day reversals in opposite
directions on Tuesday and Wednesday of last week.
2) After an
uneventful Thursday there was a solid break above the recent trading range
last Friday.
3) Friday's price action looked bullish, but on Monday
of this week the gold price more than fully retraced Friday's gain and
closed below its 20-day MA.
4) Monday's price action looked
bearish, but the bulk of Monday's loss was recouped over the course of
Tuesday and Wednesday.
The indecisive price action could be due to
the opposing forces of a fundamental tailwind and a sentiment headwind.
The gold price should be rallying in response to a fundamental backdrop
that is unequivocally bullish at this time, but rallies can't get any
traction because the speculating community is already net long in a big
way.
Our expectation is the same now as it was when we wrote the latest
Weekly Update. We think that a multi-week rally to the mid-$1300s (at
most) is underway.
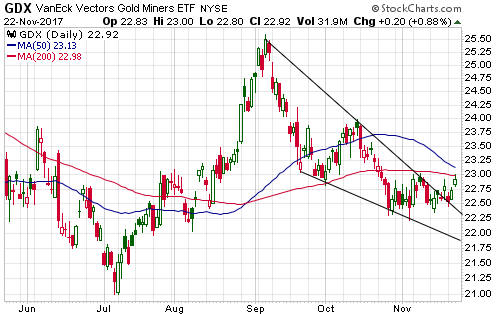
Gold Stocks
The
gold-mining sector, as represented on the following chart by GDX, held up
well in the face of Monday's sharp decline in the gold price and then
moved up to resistance at $23.00 over the ensuing two days. A daily close
above $23.00 would break GDX above its 200-day MA and confirm that a
short-term rally was underway.
As noted in the latest Weekly Update, if a short-term rally is
underway in the gold-mining sector and this year's cyclical pattern
continues then the next 1-2 month top could occur as soon as
early-December or as late as early-January. More specifically, a
continuation of the cyclical pattern would result in an early-December top
followed by a sharp decline to an early-January bottom OR a rally to an
early-January top.
The Currency Market
The
Dollar Index (DX) has now retraced about half of its September-October
rally, which means that the decline from the early-November peak is still
within the bounds of a normal correction. At the same time, it has closed
below its 50-day MA and unless it rebounds on Friday -- the US financial
markets being closed on Thursday for Thanksgiving -- it will end the week
below its 20-week and 200-week MAs. Ending the week below these weekly MAs
would have bearish implications.
The main reason to believe that the DX's early-November peak will not
turn out to be the ultimate peak for the rally that began in September is
related to sentiment. The sentiment situation recently became very
supportive for both the Yen and the Swiss Franc, but for all intents and
purposes the DX is the reciprocal of the euro and the speculating
community remains lopsidedly bullish about the euro's prospects. This
limits the euro's short-term upside potential and the DX's short-term
downside potential.
Updates on Stock Selections
Notes: 1) To review the complete list of current TSI stock selections, logon at
http://www.speculative-investor.com/new/market_logon.asp
and then click on "Stock Selections" in the menu. When at the Stock
Selections page, click on a stock's symbol to bring-up an archive of
our comments on the stock in question. 2) The Small Stock Watch List is
located at http://www.speculative-investor.com/new/smallstockwatch.html
![]() In
an email sent to subscribers on Monday (20th November) we added Resolute
Mining (RSG.AX) to the TSI Stocks List as a short-to-intermediate-term
trade.
In
an email sent to subscribers on Monday (20th November) we added Resolute
Mining (RSG.AX) to the TSI Stocks List as a short-to-intermediate-term
trade.
It's possible that RSG will become available at a
significantly lower level early next year in sympathy with a final
sector-wide decline (the price chart would point to a target of around
A$0.75 if support near A$1.00 were to give way), but there's no guarantee
that a final sector-wide decline lies in store and RSG offers very good
value near its current price in the low-A$1.00 area. That's why we
suggested buying half a position near the current price with the aim of
buying the other half IF there's a sector-wide sell-off into an early-2018
low.
Chart Sources
Charts appearing in today's commentary
are courtesy of:
http://stockcharts.com/index.html
http://www.barchart.com/
http://bigcharts.marketwatch.com/
![]()