|
- Interim Update 23rd January 2013
Copyright
Reminder
The commentaries that appear at TSI
may not be distributed, in full or in part, without our written permission.
In particular, please note that the posting of extracts from TSI commentaries
at other web sites or providing links to TSI commentaries at other web
sites (for example, at discussion boards) without our written permission
is prohibited.
We reserve the right to immediately
terminate the subscription of any TSI subscriber who distributes the TSI
commentaries without our written permission.
Is the
"Shale Revolution" an economic game-changer for the US?
There is always an economic benefit to producing more of
something useful, provided that the additional production is cost
effective. The new drilling technology that taps the vast US oil and
gas reserves contained in shale formations has increased the
production of useful commodities in a cost-effective way and is
therefore a plus for the US economy. However, the extent to which it
is a plus has been greatly exaggerated in some quarters. The
so-called "Shale Revolution" isn't an economic game-changer, the
reason being that it doesn't come close to offsetting the damage
being done to the US economy by the government and the Federal
Reserve.
To establish the validity of the above statement it helps to roughly
quantify the potential benefits of the increase in US oil production
stemming from the ability to tap shale deposits. We'll start by
pointing out that the US consumes oil at the rate of 19M barrels per
day (b/d) and produces oil at the rate of 6M b/d, with the
difference being imported. About 4M b/d are imported from OPEC
countries, although Canada is the single country that exports the
most oil to the US (Canada supplies oil to the US at the rate of
about 2M b/d).
Now, there are two (as far as we know) ways to quantify the
financial benefit to the US economy from increasing domestic oil
production. The first is based on the fact that, putting security
concerns aside, there is no inherent economic advantage to producing
something locally versus importing it. The advantage comes in going
about business in the most cost-effective way. For example, if it
cost $80/barrel to produce oil locally and the same oil could be
purchased at $40/barrel from elsewhere, then there would be a
substantial economic disadvantage involved with producing oil
locally.
In the case of shale-oil production, the economic benefit to the US
-- again, not considering security issues -- would come from a
reduction in the cost of a barrel of oil. If oil, which is now
trading at around $95/barrel (basis West Texas Intermediate - WTI),
would be trading at $115/barrel were it not for the production from
shale formations, then $20/barrel would be one plausible way of
putting a number to the Shale Revolution's current contribution to
US economic progress. At the current daily consumption rate of
around 19M barrels, $20/barrel equates to about $140B per year.
Considering the present difference in price between
North-Sea-sourced Brent Crude Oil and US-sourced WTI Crude Oil*, a
reasonable argument could be made that shale-oil production in the
US has, indeed, lowered the price of US-produced oil by around
$20/barrel. However, the full price reduction only applies to the
roughly one-third of total US oil consumption that gets produced
locally. Therefore, if we are correct to assume that shale
production has caused the price of WTI to be $20/barrel lower than
it would otherwise be, then the total benefit to the US economy is
probably no more than $70B/year (0.5% of annual GDP).
The benefit described above has already occurred. What we are more
interested in is what could happen in the future if the "Shale
Revolution" continues to increase the amount of oil produced in the
US.
The maximum potential benefit is limited by production cost. There
are many billions of barrels of oil trapped in shale formations, but
the process of getting the oil out is not cheap and probably never
will be. For example, it isn't realistic to posit a scenario in
which the oil price makes a sustained move to $50/barrel or lower,
because a lot of US and Canadian production would be uneconomic at
that price. In our opinion, due to the depreciation of money and the
resultant increases in the prices of the labour and materials used
to get oil out of the ground, oil's lower price limit is probably
now around $70/barrel. This means that in current dollar terms, the
MAXIMUM future benefit that could possibly arise due to the Shale
Revolution is roughly $140B/year (a $20 reduction in the cost of
every barrel of oil consumed by the US economy).
The other way to come up with a very approximate figure for the
Shale Revolution's maximum potential benefit is to assume that the
US economy doesn't forego additional production elsewhere in order
to increase its oil production. This isn't realistic, because at
least some of the resources used by the oil industry to ramp up its
production would otherwise be directed towards increasing the
production of something else. However, it's a reasonable assumption
to make when attempting to come up with a maximum potential benefit.
If additional production by the oil industry doesn't result in
reduced production by another industry, then every dollar of
additional production stemming from the Shale Revolution will make
US GDP one dollar higher than it would otherwise be. It's possible
that further development of the shale oil fields could lead to
domestic US oil production rising from 6M-b/d to 8M-b/d over the
next few years. 2M-b/d of additional domestic oil production at an
average price of $80/barrel amounts to $58B per year of potential
benefit.
So, in very rough terms we estimate the MAXIMUM potential economic
benefit from the Shale Revolution within the next few years to be
somewhere between $60B and $140B per year.
Let's now do a quick comparison. The Fed is planning to create about
$1T of additional money** this year and the US federal government is
going to run a budget deficit of around $1T this year. Therefore, on
the one hand we have $2,000B of damage being planned by the
government-Fed combo for this year and on the other hand we have a
maximum economic benefit from shale oil that could, if all goes
well, amount to $60B-$140B/year a few years from now. Not much of a
comparison, is it?
The bottom line is that there isn't a realistic possibility of the
US private sector coming up with something that will offset the
counter-productive actions of the government and the Fed. The
counter-productive actions have become too massive for that.
Furthermore, productivity improvements that partially offset the
superficial effects of bad policies are only likely to embolden the
policy-makers.
To end the economic trends of the past 13 years, major directional
changes in the political and monetary realms will be required.
Unfortunately, changes of this magnitude usually don't happen until
economic hardship forces them to happen.
*WTI Crude tended to trade at a premium to Brent Crude
until about three years ago, when the relationship changed. Over the
past three years WTI Crude has traded at an average discount of
around 10% to Brent, despite WTI being the 'lighter' oil. The change
in the relationship is almost certainly due to the increase in US
oil production caused by the "Shale Revolution".
**The Fed's monetary inflation gives GDP a short-term
boost, but it hurts the wealth-creation process (GDP measures
activity, not real progress). It gives the GDP calculation a
short-term boost because with more dollars sloshing around the
economy the sum of the dollar values of all transactions will
necessarily be higher. It hurts the wealth-creation process because
it effects a transfer of purchasing power from the relatively
productive to the relatively unproductive. Think of it this way: the
Fed creates additional claims on goods, services and capital, but
doesn't create any additional goods, services and capital. As a
result, some people end up with a greater total claim on the
economy's wealth, but only at the expense of other people.
The Stock Market
The divergence continues
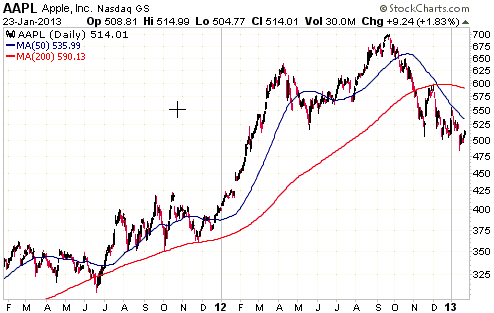
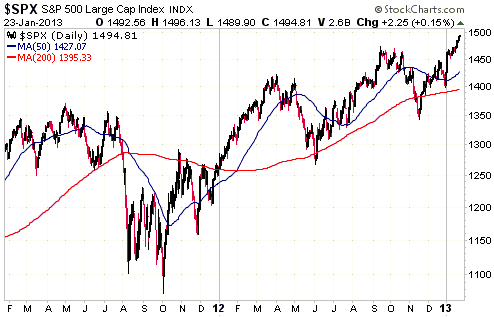
Daily charts of Apple (AAPL) and the S&P500 Index (SPX) are displayed below.
There has been an extraordinary divergence between the SPX and the SPX's most
important component (AAPL) since mid-September. And based on after-hours trading
in AAPL shares on Wednesday following the announcement of the company's latest
results and guidance, the divergence is likely to become even more extraordinary
when the US stock market opens on Thursday 24th January. It's distinctly
possible that AAPL will trade as low as $450 on Thursday. If so, it will be down
by about 35% over a 4-month period during which the SPX has risen.
Wednesday's after-hours plunge in AAPL shares appears to be a response to news
that iPhone sales were a few percent less than expected during the December
quarter and will be a few percent less than expected during the March quarter.
The market is obviously extrapolating the recent reduction in the pace of AAPL's
growth well into the future, because the stock will have a single-digit P/E
ratio if it drops to the mid-$400s on Thursday. A single-digit P/E for a
financially-strong highly-profitable company implies widespread belief that the
company's business will either stagnate or shrink from its current level. Is
this belief realistic in AAPL's case? We don't know, but we suspect that AAPL
could prove to be a good 1-3 month trade if purchased near $450 this week.
The fear and loathing that now engulfs AAPL is a stark contrast to the bullish
complacency that dominates the broad market. The prevailing belief seems to be
that economic conditions will slowly improve over the months/quarters ahead and
that despite the improving economy the Fed will continue to flood the world with
dollars. Not only that, but the euro-zone's debt problems have been fixed and
the BOJ is set to become as profligate as the Fed and the ECB. What could
possibly go wrong?
Current Market Situation
The SPX and a lot of important stock indices have been moving relentlessly
higher at a slow pace. The SPX, for example, has just risen for six days in a
row, but the cumulative gain over the course of this 6-day winning streak is
only 1.6%.
All important SPX peaks over the past 6 years have occurred at the ends of slow,
relentless advances. The advances have invariably continued for longer than we
thought they would, but once a top has been put in place the gains of the
preceding few months have always been quickly given back. We have no reason to
believe that it will be different this time.
Gold and the Dollar
Gold
Gold has tested the resistance range defined by its 50-day moving average and
its channel top multiple times over the past week.
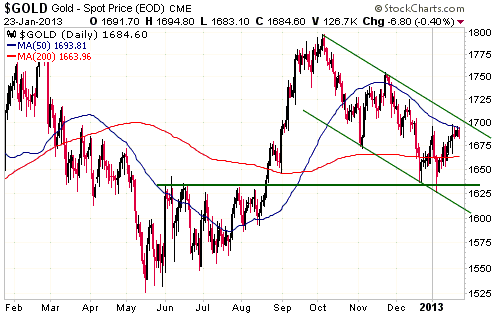
With economic confidence on the rise there hasn't been enough new investment
demand for gold to break the US$ gold price above the aforementioned resistance.
While we won't exactly be shocked if gold soon manages to break out to the
upside, the more likely near-term outcome is that the market spends the next
couple of weeks between $1650 and $1700.
Gold Stocks
After several days of going sideways, the HUI fell sharply on Wednesday. This
obviously wasn't in accordance with our script.
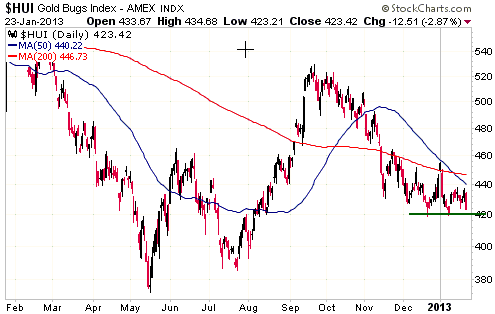
Support at 420 hasn't yet been breached, so perhaps Wednesday's decline will
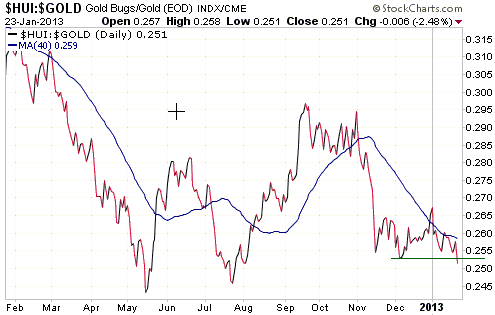
turn out to be part of another successful test of this support. However, the HUI/gold
ratio has just declined to a new multi-month low, which negates the positive
divergence between the gold-mining sector and gold bullion that emerged during
the second half of December and the first week of January. Breakouts in the HUI/gold
ratio are a lot less meaningful now than they were during the 'good old days' of
2000-2006, but Wednesday's downside breakout in HUI/gold should still be viewed
as a warning.
On the bullish side of the ledger is the fact that the HUI/SPX ratio has
returned to its May-2012 bottom. This should be viewed as bullish because it
means that relative to the broad stock market the gold sector is now close to
its most 'oversold' extreme of the past 10 years, and on the rare occasions when
a market reaches such an extreme it will usually be very close to a price low.
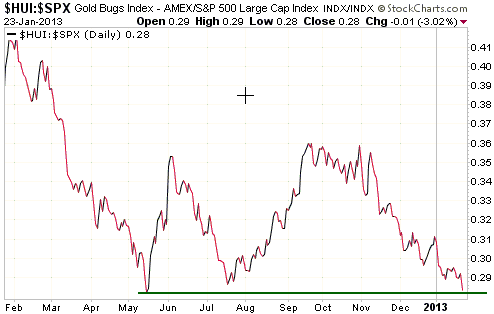
The upshot is that the HUI could be about to break below support at 420, but if
it does there probably won't be substantial follow-through to the downside.
Regardless of whether or not 420 holds, we suspect that:
a) The HUI will bottom within the next two weeks.
b) If the next bottom is within a few percent of the May-2012 low then it will
be the low for the year, but if the next bottom is above 400 then it will be
followed by a multi-week rally and then a decline that creates the low for the
year near the May-2012 low.
Currency Market Update
The BOJ yielded to the political pressure and officially adopted a 2%
"inflation" target. However, the BOJ also stated that 1) it wasn't going to
start taking additional measures (asset purchases beyond the program already in
place) until January of 2014, and 2) it expected "inflation" to be only 0.4% in
2013 and 0.9% in 2014. These new "inflation" forecasts are almost identical to
the forecasts made by the BOJ last October.
In effect, the BOJ has thrown the government a bone, but has decided not to do
anything different this year and has stated that its "inflation" expectations
for the next two years are not materially different now than they were a few
months ago. In particular, despite adopting the government's desired "inflation"
target, the BOJ doesn't expect that the actual "inflation" rate will come close
to this target over the next two years.
So, currency speculators have been aggressively selling the Yen over the past
couple of months in anticipation of something that we now know is almost
certainly not going to happen this year and might not happen next year. No
wonder there was such a small reaction in Japan's bond market to all the talk of
massive currency depreciation. The bond market appears to have known all along
that the BOJ would do no more than 'pay lip service' to the government's
"inflation" goal.
In our 2013 Yearly Forecast we stated that the BOJ would give-in to government
pressure to set an "inflation" target of 2% and would eventually do what was
required to achieve the target, but that it was an even-money bet as to whether
or not the BOJ would take the monetary measures required to actually achieve the
official target anytime soon. A huge problem facing the Japanese government and
the BOJ is that if the Yen really did begin to depreciate at the rate of at
least 2% per year and the bond market believed that the depreciation would
continue, then interest rates would rise to the point where the Japanese
government's interest payments were greater than its total revenue. Under such
circumstances the government would be forced to restructure (default on) its
debt.
The Yen has slowly begun to rebound due to the BOJ news and the simple fact that
it is incredibly 'oversold'. There's a good chance that this rebound will evolve
into something worth trading, although meaningful strength in the Yen might wait
until after the global stock market starts trending downward.
Update
on Stock Selections
Notes: 1) To review the complete list of current TSI stock selections, logon at
http://www.speculative-investor.com/new/market_logon.asp
and then click on "Stock Selections" in the menu. When at the Stock
Selections page, click on a stock's symbol to bring-up an archive of
our comments on the stock in question. 2) The Small Stock Watch List is
located at http://www.speculative-investor.com/new/smallstockwatch.html
 Update
on the post-tax-selling rebound trade Update
on the post-tax-selling rebound trade
In the 24th December Weekly Update we introduced a short-term trade that
combined 5 beaten-down junior gold stocks from the TSI List. Here is the
situation as at the close of trading on Wednesday 23rd January, with the
starting price, current price and percentage change shown after each stock
symbol:
BAT.V C$0.455 C$0.43 -5.5%
CFO.V C$0.71 C$0.88 +23.9%
GPD.TO C$0.315 C$0.37 +17.5%
ITH.TO C$1.85 C$2.24 +21.1%
VTR.TO C$0.44 C$0.475 +7.9%
Average price change to date: +13.0%
A 13% gain in one month is not a disaster, but it's fair to say that this trade
hasn't done as well as expected considering the extent to which the juniors were
'oversold' late last year and the strength at the junior end of the gold sector
that typically occurs from late-December through to at least February. The main
problem is the lacklustre performance of the overall gold sector, in that the
HUI is down by 1% since the start of our "tax rebound trade". There has
certainly been significant relative strength at the junior end of the market
over the past month, but due to the unimpressive performance of the larger
stocks this relative strength hasn't translated into substantial absolute
strength.
We are bullish on each of the above stocks, but with the HUI again threatening
to break below support at 420 we are ending the short-term trade now.
As an aside, BAT.V was by far the worst performer in the above group of
tax-rebound candidates. It was the only stock that lost ground. We know of no
company-specific reason for BAT's sluggishness, although we wouldn't be
surprised if some speculators sold due to the perception of increasing risk
associated with foreign mining companies operating in Colombia. The perception
of greater risk for Colombia-based miners is linked to the
recent kidnapping, by a terrorist organisation, of three employees and two
consultants of Braeval Mining (BVL.TO). BAT and most other Colombia-based
Canadian miners aren't working in high-risk parts of the country, but when
something bad happens in one part of a Latin American country the stocks of all
companies focused on that country tend to get sold indiscriminately.
BAT is a reasonable speculation near its current price ahead of the PEA
scheduled to be complete within the next two months.
 Update on GDXJ short-term trade
It's possible that the HUI is just about to complete another
successful test of support at 420, but we didn't think that there
would be another test at this time. With the gold sector deviating
bearishly from the anticipated short-term path it's best that we
exit our GDXJ trade while we can still do so near break-even.
Intermediate-term GDXJ positions can simply be averaged into on
weakness. We expect that positions purchased in the $17-$20 range
will show large gains before this year is out.
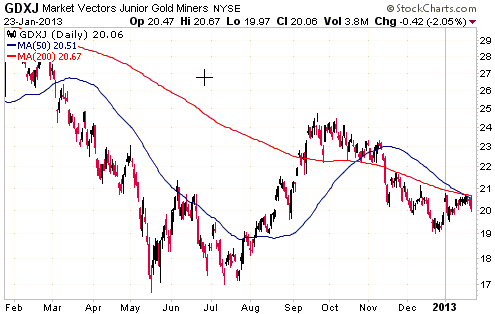
Chart Sources
Charts appearing in today's commentary
are courtesy of:
http://stockcharts.com/index.html

|

