|
- Interim Update 23rd March 2011
Copyright
Reminder
The commentaries that appear at TSI
may not be distributed, in full or in part, without our written permission.
In particular, please note that the posting of extracts from TSI commentaries
at other web sites or providing links to TSI commentaries at other web
sites (for example, at discussion boards) without our written permission
is prohibited.
We reserve the right to immediately
terminate the subscription of any TSI subscriber who distributes the TSI
commentaries without our written permission.
Long-term bearish on China and the US
When
it comes to their outlooks for China's economy, most analysts fall into
one of two groups. The first group is outright bullish on China's
prospects over all time frames, while the other is very optimistic on a
long-term basis but is concerned about the potential for a painful
short- and/or intermediate-term 'correction'. In other words, most
analysts are long-term bullish.
As discussed in the past, we fall into neither of these groups. We also
can't be counted amongst the naive souls who labour under the delusion
that the US is still the "land of the free" and that China is still a
Soviet-style basket case.
We are long-term bearish on the economies of both the US and China,
primarily because the governments of both countries are now headed down
paths that involve using monetary inflation and greater government
control of the economy in an absurd effort to counteract the disastrous
effects of earlier monetary inflation and controls (China spent much of
the past three decades in a bullish trend as far as government
involvement in the economy is concerned, but that trend appears to have
ended). We are also concerned that there is very little understanding
amongst economists, politicians and members of the general public as to
what caused the global financial crisis and what should be done to
ensure greater stability in the future. In particular, hardly anyone
fully understands how monetary inflation affects the economy. Most of
the people who appreciate that there is a link between money supply and
prices believe that money-supply growth is only a problem to the extent
that it brings about an increase in the general price level.
The reality is that an increase in the general price level, which can
more aptly be described as a decrease in the purchasing power of money,
is just one of the effects of monetary inflation. And of these effects,
a decrease in the purchasing power of money is the LEAST important.
Of greater importance is that substantial monetary inflation results in
mal-investment on a grand scale, which means that it leads to the
economy-wide wastage of resources and reduction of wealth. It does this
in two ways, the first being its non-uniform mode of operation (the way
that some prices rise earlier and faster than others in response to the
increasing money supply). Changes in relative prices are the signals
upon which the market economy relies, and when these signals are
artificial (meaning: due to additional money rather than due to
sustainable changes in consumer demand) the result is a cluster of
investing and resource-allocation errors. The errors occur during the
inflation-fueled boom, but they don't become apparent until the ensuing
bust. The bust is effectively the period when the "chickens come home
to roost".
Monetary inflation also leads to mal-investment by creating the
impression that there is a greater amount of real savings than is
actually the case. It has this effect because it lowers the interest
rate.
Here's what is supposed to happen: people reduce their current
consumption and save more, with the goal of increasing their wealth and
being in a position to consume more in the future. This causes the
interest rate to fall, which entices entrepreneurs and other
businessmen to invest in long-term projects (property developments, new
manufacturing facilities, mines, major expansions and upgrades, etc.).
Although most individual entrepreneurs and businessmen won't think of
it in this way, they are responding to a signal that the public is
saving more today in preparation to spend more in the future.
What happens, though, if the fall in the interest rate is induced by
the central bank boosting the money supply? In this case the same
signals will initially be sent to the capital markets, but there will
have been no reduction in present consumption and no concomitant
increase in real savings. Entrepreneurs and businessman will undertake
long-term projects based on the assumption that the public will have
more real wealth to spend in the future, while the public is REDUCING
its future capacity for real spending by consuming aggressively in the
present. In other words, a mismatch emerges. This mismatch can continue
to develop for years, but the longer it develops the worse the
inevitable bust will be when reality strikes.
The effects of the mal-investment wrought by the past decade's monetary
inflation in the US are evidenced not only by the dismal state of that
country's residential real estate market (the focal point of the boom),
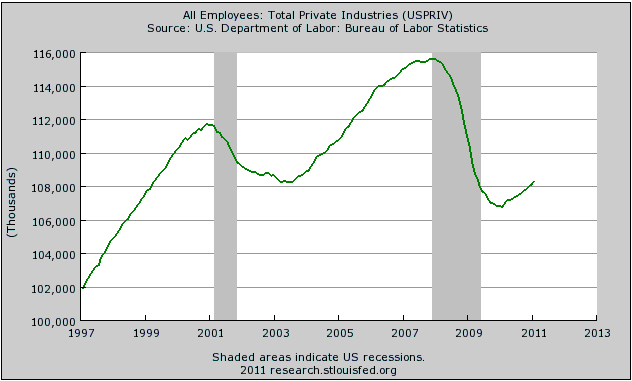
but also by the state of the labour market. The following chart from
the St Louis Fed's web site shows that total private sector employment
in the US today is at around the same level it was at the beginning of
1999. To put it another way, the chart shows that there has been no
net-increase in US private-sector employment over the past 12 years.
This poor performance has a number of policy-related causes, but in our
opinion the mal-investment associated with Greenspan's two
inflation-fueled booms is by far the most important.
Unfortunately, Bernanke is now trying to create another inflation-fueled boom.
The problems that
stem from many years of monetary inflation and bad government policy
are obvious in the US, even if they are usually misdiagnosed. They are
obvious because the boom has already turned to bust. They aren't
obvious yet in China, though, because the inflation-fueled boom is
still going.
Due to many years of mal-investment on an unprecedented scale, China is
an economic bust waiting to happen. In itself this wouldn't be a good
reason to be long-term bearish, because left to its own devices an
economy is capable of recovering from a major misalignment of
production and consumption within a couple of years. This would
especially be so in the case of China due to the strong work ethic and
self-reliance of its population. The reason we are long-term bearish is
that there is little chance of China's economy being left to its own
devices. Based on the fact that China's policy-makers have made similar
mistakes to their Japanese and US counterparts up until now, it's a
good bet that they will continue to do so.
The Stock Market
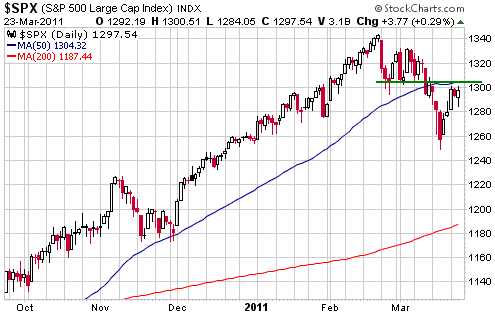
The
S&P500 Index plunged below short-term support in the low-1300s
during the first half of last week and has since rebounded back to this
former support (which is now resistance). This means that the rebound
has gone about as far as it should go IF the recent decline is going to
evolve into something more serious than a routine short-term
correction. To put it another way, if the S&P500 closes above
resistance in the low-1300s over the coming days then the downturn that
began in mid February was probably just a correction within an on-going
intermediate-term advance.
The world is poorer
as a result of Japan's recent massive earthquake, the reason being that
a lot of real wealth has been destroyed. Furthermore, the government
and central-bank responses to Japan's 'economic hit' will add to the
existing inflation problem and result in slower long-term economic
progress, for the reasons discussed earlier in today's commentary.
There will, however, be some winners, such as the companies directly
involved in new construction work in the earthquake-ravaged areas and
the companies that supply the materials and equipment used in the
rebuilding effort.
It seemed that on Wednesday 23rd March the stock market began to
discount an increase in the demand for industrial metals that will stem
from Japan's coming rebuilding effort. While there is some logic to
this, it should be remembered that the prices of these metals are
already very high and that the swings in China's economy are going to
be far more important, as far as industrial metals markets are
concerned, than the reconstruction work associated with Japan's
earthquake.
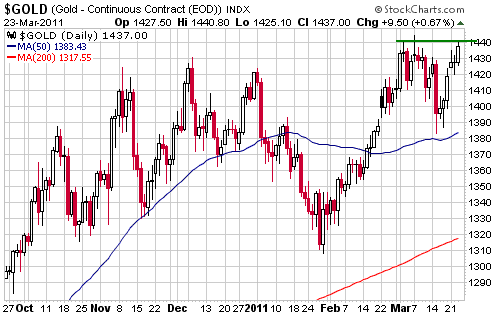
Gold and
the Dollar
Gold and Silver
The following three charts sum up the current market situation.
First, we have a daily chart of the gold price in US$ terms, which
shows that US$ gold is testing the intra-day highs made earlier this
month and has just achieved its highest daily close. It has risen for 6
days in a row and is thus extended to the upside on a very short-term
basis, but this only means that there will soon be a 1-3 day pullback.
The price action suggests that new highs will be made within the coming
fortnight.
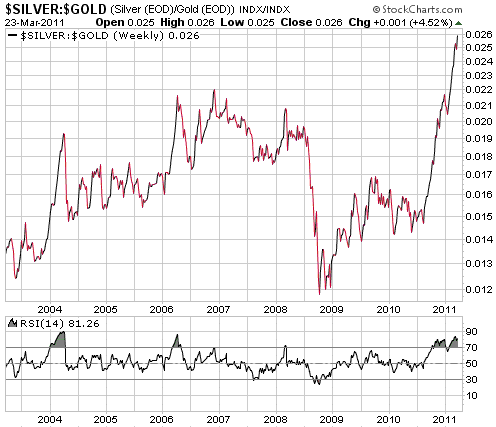
Next, we have a
weekly chart of the silver/gold ratio. This ratio remains
extraordinarily 'overbought' on a short-, medium- and long-term basis,
but it hasn't yet signaled a top. This chart suggests that new highs
are likely for both gold and silver. It also suggests that traders
should be 'dancing close to the exit'.
Lastly, we have a
daily chart of the gold price in euro terms (gold/euro). Whereas the
US$ gold price looks like it is about to break into new-high territory,
gold/euro remains a comfortable distance below its December-2010 peak.
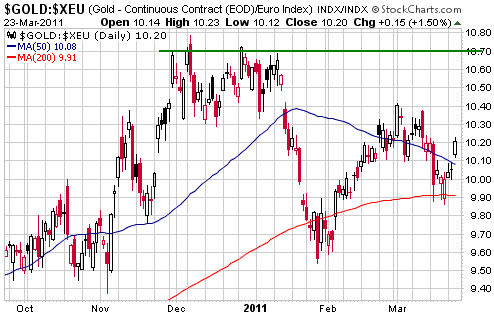
Gold is probably on
its way to new highs in US$ terms, but it will be interesting to see if
these new highs are confirmed by the euro-denominated gold price. The
combination of new highs in the US$ gold price and significantly lower
highs in the euro gold price would be a bearish divergence. Assuming no
large change in the US$/euro exchange rate, a move to a new high in the
euro-denominated gold price would require a move to well above
$1500/ounce in the US$ gold price.
Cycle analysis suggests that the rallies in gold and silver could
continue until the first half of May. This is certainly possible, but
we don't think it is prudent to bet on such an outcome.
As mentioned in a TSI commentary a couple of weeks ago, we are hedging
(obtaining insurance) by scaling into SLV July put options as silver
ramps upward. We bought some SLV puts when silver traded up to $36
during the first half of March with the aim of buying more with every
additional $2-$3 gain. This means that our next insurance purchase will
occur at $38-$39.
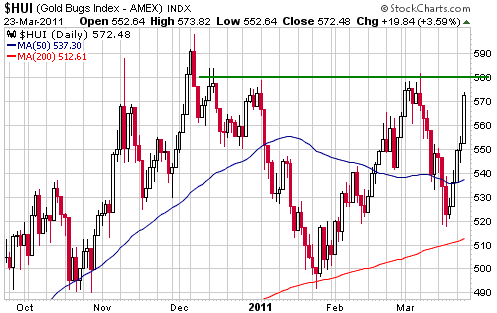
Gold Stocks
The gold sector, as represented on the following daily chart by the
HUI, has rebounded strongly over the past few days. It has just risen
for 5 days in succession and is nearing important resistance, which
means that it will probably soon have a 1-3 day pullback. However, it
is not yet 'overbought' on even a short-term basis.
The gold sector of
the stock market is not leading the bullion market. It is most
definitely the other way around, in that gold and silver stocks are
getting dragged higher by the metals. In fact, it almost seems as if
the stocks want to fall, but the metals won't let them. Moreover, the
performance of the average gold stock has recently been a lot worse
than the performance of the HUI, meaning that most individual gold
stocks are lagging the bullion by even more than suggested by the
gold-stock indices.
On a short-term basis, weakness in the stocks relative to the bullion
is generally bearish. Note, though, that it wouldn't take much
additional strength in the stocks from here to push the HUI into
new-high territory and eliminate this short-term bearish signal. On a
long-term basis, weakness in the stocks relative to the bullion is 'par
for the course'. As we've previously explained, gold stocks, as a
group, have been weakening relative to gold bullion since 1968.
Regardless of what lies immediately ahead, this week's move in the HUI
to near resistance at 580 has created an opportunity to do a modicum of
selling. If you have some gold and/or silver stocks that have risen
sharply over the past several days and are now at, or close to, new
highs, you should consider taking some money off the table.
Currency Market Update
Portugal's Prime Minister has just resigned due to the defeat of his
party's so-called "austerity program". This is a reminder that while
Europe's sovereign debt problem is not the currency market's present
focal point, it hasn't gone away.
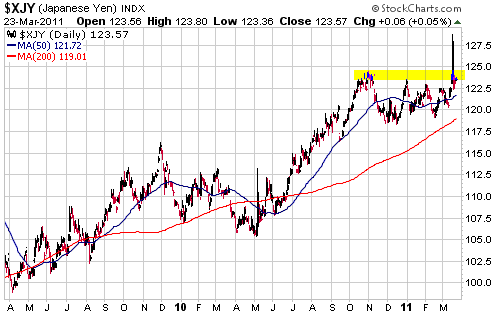
Intervention designed to help Japan's exporters has been successful, in
that the Yen has been pushed back into its 6-month range (see chart
below).
We expect that the success will only be temporary and that the Yen will
strengthen against most currencies over the next two months as Japanese
capital is repatriated. We also expect that 2-3 months of additional
Yen strength will be followed by a Yen bear market. This view is based
on the assumption that Japan's monetary authorities will increasingly
resort to monetary inflation in their efforts to finance government
spending and support export industries.
Update
on Stock Selections
(Notes: 1) To review the complete list of current TSI stock selections, logon at http://www.speculative-investor.com/new/market_logon.asp
and then click on "Stock Selections" in the menu. When at the Stock
Selections page, click on a stock's symbol to bring-up an archive of
our comments on the stock in question. 2) The Small Stock Watch List is
located at http://www.speculative-investor.com/new/smallstockwatch.html)
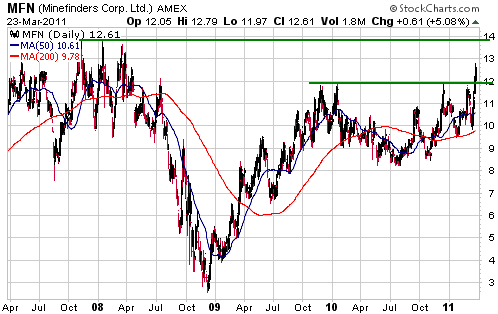
 Minefinders Corp. (AMEX: MFN). Shares: 80M issued, 96M fully diluted. Recent price: US$12.61 Minefinders Corp. (AMEX: MFN). Shares: 80M issued, 96M fully diluted. Recent price: US$12.61
The following chart shows that MFN broke above resistance to a new
multi-year high during the first half of this week. The breakout
creates a measured chart-based objective of $15.50-$16.00. Also of note
is the long-term resistance at around US$14.
Based on normal
valuation metrics and the company's 135K gold-equivalent production
forecast for this year, MFN is now close to being fully valued. It
offers good value relative to most silver stocks, but this is because
most silver stocks are now very over-valued.
Due to valuation and the fact that the silver rally is now very 'long
in the tooth', we think it makes sense to scale out of MFN in the
$13-$15 range. For TSI record purposes, we will exit the stock if it
trades at US$13.40 within the next few weeks.
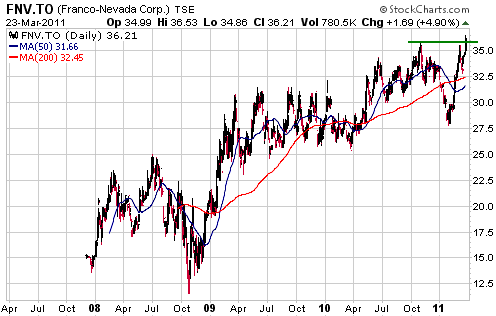
Franco Nevada March-2012 C$32.00 Warrants (TSX: FNV.WT). Recent price: C$6.14
The following chart shows that Franco Nevada, one of the world's two
premier gold royalty stocks, hit a new all-time high on Wednesday. This
gave our FNV warrants a significant boost.
In the 7th March Weekly Update we wrote:
"...holders of the
warrants should plan to scale out of their positions into strength over
the next two months. Our previously noted C$10 price target still looks
feasible, but in order for this target to be achieved the FNV stock
price will have to move up to around C$40."
Due to Wednesday's price action, C$40 for the stock and C$10 for the
warrants looks even more feasible. However, we continue to believe that
it makes sense to gradually exit into strength.
For TSI record purposes, we will exit the warrants if they trade at C$9.50 within the next few weeks.
Pretium Resources (TSX: PVG). Shares: 81M issued, 84M fully diluted. Recent price: C$11.38
PVG came under some selling pressure on Wednesday due to the
announcement that Silver Standard Resources (SSRI), the owner of 42% of
PVG, was planning to exit its stake via a secondary offering. SSRI
never intended to be a long-term holder, so Wednesday's news wasn't a
surprise.
This development could cause PVG to remain under pressure for the next
1-2 weeks, but it is a longer-term plus because it will improve
liquidity and allow some institutions to get positioned in the stock.
Duoyuan Global Water (NYSE: DGW). Shares: 25M. Recent price: US$7.22
DGW took another stock-market hit on Wednesday in response to the
release of its latest quarterly financial report. The report revealed a
significant slowdown in the company's growth and reduced gross margins
due to increasing costs, but everything with this company is now
secondary to the on-going third party audit of its accounts. Even if
growth stopped altogether the company is probably worth more than twice
its current market capitalisation IF its published accounts can be
trusted.
The main reason for Wednesday's high-volume decline was probably the
statement, included in the latest quarterly report, that the results of
the third party audit would not be available until the end of the
second quarter. This means that the audit is taking much longer than
most people expected (the original expectation was that the audit would
be complete within 4 months, but it now looks like taking 9 months).
There is no evidence at this time that there is anything wrong with
DGW's accounting, but the audit delays certainly don't instill
confidence.
DGW's market cap is now roughly the same as its working capital, which
means that its profitable water treatment/purification business is
being valued by the stock market at roughly zero. This would make it a
low-risk/high-potential-reward situation if we could be confident that
the accounts were accurate. As it is, it's a
high-risk/high-potential-reward situation.
Chart Sources
Charts appearing in today's commentary
are courtesy of:
http://stockcharts.com/index.html

|