|
- Interim Update 23rd June 2010
Copyright
Reminder
The commentaries that appear at TSI
may not be distributed, in full or in part, without our written permission.
In particular, please note that the posting of extracts from TSI commentaries
at other web sites or providing links to TSI commentaries at other web
sites (for example, at discussion boards) without our written permission
is prohibited.
We reserve the right to immediately
terminate the subscription of any TSI subscriber who distributes the TSI
commentaries without our written permission.
A more flexible Yuan
China's
central bank has been using monetary inflation to keep its currency
(the Yuan) at an artificially low level against the US$. To be more
specific, to offset upward pressure on the Yuan/USD exchange rate the
People's Bank of China (PBOC) purchases US dollars using Yuan that it
creates out of nothing. This, however, promotes mal-investment and
elevates prices within China. The most dramatic price rises have
occurred within the residential property markets of the largest cities,
but over the past year the superficial effects of the monetary
inflation (rising prices) have started to become more widespread and
have led to a heightened level of social unrest (more strikes, for
example). Consequently, China's political leadership is belatedly
coming to realise that an artificially cheap currency is not in the
country's best interest. This is what prompted last weekend's
announcement that the Yuan's exchange rate will become more flexible,
the idea being that gradual strengthening of the Yuan would help
ameliorate the inflation threat.
In Monday's email alert we said that the announced change in China's
currency policy pales in comparison with issues such as the unfolding
debt crisis in Europe, the US government's deficit-spending and debt
build-up, planned increases in government theft (direct and indirect
taxation) throughout the world, the likelihood that more problems will
emerge over the months ahead in real estate and real-estate-related
loans, central bank debt monetisation, and the unravelling of the
economic recovery of the past 15 months. In other words, it isn't
remotely close to being the most important issue at this time and
probably won't have a significant effect on how the major financial
markets perform over the remainder of this year. That being said, it is
worth considering some of the potential longer-term implications of a
change in the way China's government 'manages' the Yuan's exchange
rate, based on the speculative assumption that policymakers won't
revert back to their old ways as soon as the economy slows.
First, if the new exchange rate policy leads to reduced Yuan-printing
by the PBOC then China's economy will benefit from lower inflation over
the years ahead, meaning that the economy will experience less
distortion of relative prices and probably become more efficient.
Second, a less frenetic pace of development in China's property market
(due to less monetary inflation) would reduce the demand for industrial
metals and some other commodities, thus causing the prices of these
commodities to be lower than would otherwise be the case.
Third, after China's central bank purchases US dollars with newly
created Yuan it turns around and uses these dollars to purchase US
Treasuries. A more flexible Yuan policy could therefore result in lower
demand on China's part for US government debt, which could lead to
higher interest rates in the US.
Fourth, a stronger Yuan may or may not lead to higher prices for
China's exports (and, therefore, to higher import prices for countries
such as the US). The reason is that a stronger Yuan would lead to lower
Yuan-denominated prices for China's raw material imports, which could
enable China's exporters to maintain current profit margins without
increasing the US$-denominated prices of their products.
Fifth, there is no good reason to believe that a small (2%-10%) rise in
the Yuan/USD exchange rate would lead to a meaningful increase in US
exports to China. Note that a small rise is the most that can
reasonably be anticipated.
Finally and perhaps most importantly, there is no guarantee that
allowing greater flexibility in the Yuan's exchange value would result
in a stronger Yuan beyond the short-term. This is because there has
been a huge amount of monetary inflation in China over the past several
years, the effects of which are still rippling through the economy.
Once the effects of this money-supply growth are fully reflected in the
Yuan's purchasing power it could (we think it will) turn out that the
Yuan is actually OVER-valued against the US$. It would be amusingly
ironic if US politicians got their wish for China's government to allow
market forces to dictate the Yuan/US$ exchange rate, and after an
initial surge the Yuan began to trend lower.
A couple of interesting articles
The
"Austrians" understand that economics is a logical science rather than
an empirical one, meaning that economic theory must be developed via
logical deduction rather than by experiment or by analysing historical
data. Keynesians, on the other hand, generally believe that economic
theories can be developed and validated using data. That's why it is so
strange that they relentlessly adhere to certain principles -- the
principle that an increase in government deficit-spending can help to
strengthen a weak economy, for example -- despite the availability of
so much empirical evidence to the contrary.
The Bloomberg article linked HERE contains a good example of what we are talking about. The article states:
"The key is an emphasis
on cutting spending rather than raising taxes, said Goldman Sachs
economists Broadbent and Daly in London. Lower spending means consumers
and companies don't fear higher taxes, so demand accelerates. A smaller
public sector also helps reduce borrowing costs and makes economies
more competitive as fewer government workers lighten labor expenses.
In a study of 44 large fiscal adjustments in 24 advanced economies since 1975, Broadbent and Daly discovered that reducing [government] expenditures by 1 percentage point a year boosted average annual growth by 0.6 percentage point
[the exact opposite of what is supposed to happen according to
Keynesian economics]. Raising the ratio of taxes to GDP by the same
margin cut growth by an average 0.9 percentage point.
The equity markets of the
countries that sliced spending beat those of other advanced nations by
64 percent during a three-year period, and their bond yields fell by
more than if budget adjustments had been driven by tax hikes, according
to the report." [Emphasis added]
The same article notes the following opinion of Paul Krugman, one of
the highest-profile and most respected economists in the Keynesian camp:
"It is "utter folly" for
the G-20 to be considering retrenchment with unemployment so high,
Nobel laureate Paul Krugman wrote in his blog June 6. The U.S., U.K.
and Japan also aren't "facing any pressure from the markets for
immediate cuts"".
Some governments have decided to go down the deficit-reduction path,
which is to be commended. Unfortunately, in most cases they are
attempting to reduce deficits via a combination of reduced government
spending and increased taxation, and they are leaving all the current
debt obligations in place. In our opinion, the optimum solution would
involve large reductions in government spending AND taxation, and
direct default on the existing debt.
The other article we'd like to highlight is a recent offering from Dylan Grice (one of our favourite analysts) entitled "What's the point of macro?".
This article's gist is that from a macro forecasting perspective most
of us would be best served by focusing on "grey swans", which are large
risks that can be identified in advance but whose timing is
unpredictable. Also, rather than making bets on the "grey swans", the
success of which would require accurately timing something that usually
can't be timed, our primary objective should be to avoid being
seriously hurt by such events. This can be done by steering clear of
over-valued assets and, when appropriate, buying some just-in-case
insurance for foreseeable macro risk.
The Stock Market
We've
considered the S&P500's 50-day moving average to be a likely target
for the rebound that began last month. This target was essentially
reached on Monday.
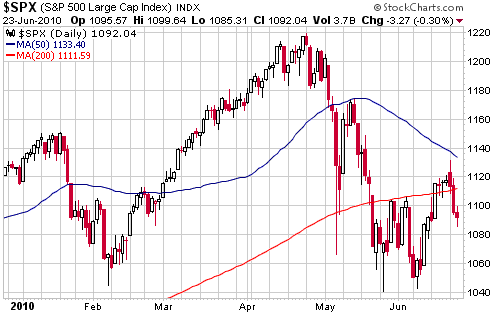
There is always a
myriad of possible outcomes, but as far as the coming 1-2 months are
concerned we think the two most likely possibilities are:
1. Monday's upward spike on the back on the China ('Yuan flexibility')
news created the rebound peak, meaning that the intermediate-term
decline has resumed.
2. The decline from Monday's peak is a pullback within a continuing
rebound, in which case a rebound peak will probably occur during the
first half of July.
Either way, the next move of significance will be to the downside.
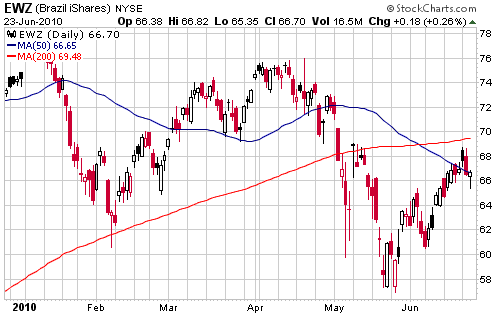
A reasonable candidate for bearish speculations is the Brazilian stock
market, as represented by EWZ. The Brazilian stock market tends to move
in lock-step with the stocks of major industrial-metal producers such
as FCX and BHP, so a short-term bet against Brazil -- for example, EWZ
put options or BZQ (a leveraged inverse index fund) -- could be used to
hedge long-term exposure to the industrial metals.
The following chart shows that EWZ moved up to the area between its
50-day and 200-day moving averages early this week. This could turn out
to have been the rebound peak, although it wouldn't surprise us to see
a marginal new multi-week high closer to $70 before the next leg down
gets underway.
Gold and
the Dollar
Gold
Sentiment in the gold market is strangely quiet considering that gold
is the only major financial market that's currently near an all-time
high. Market Vane's bullish percentage, for example, only rose as high
as 74 (versus a 3-year high of 95) when the gold price closed at a new
all-time high last Friday and is presently at 71. This means that there
is plenty of scope for traders to become more bullish.
The gold market fundamentals that really matter remain bullish, and if
anything are becoming more bullish by the week. A good example is
contained within the wording of Wednesday's FOMC announcement. In
addition to stating what everyone knew would be stated (interest rates
to be kept ridiculously low for an extended period, etc.), the Fed now
seems to be setting the stage for the next round of monetary "stimulus"
and for Europe to get the blame for derailing the "recovery" that
Bernanke and Obama have been busily taking credit for over the past
several months.
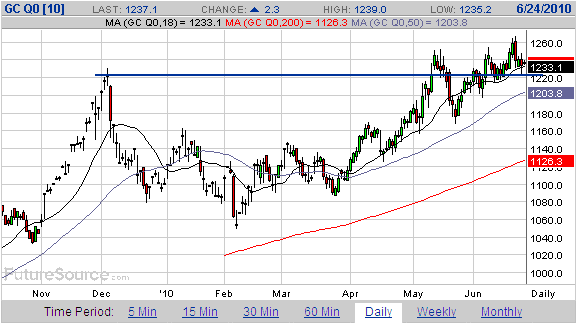
With regard to the price action, it is reasonable to give the benefit
of the doubt to the bullish case as long as support at $1220 holds. As
evidenced by the following daily chart, this support was tested on
Wednesday.
Gold Stocks
Current Market Situation
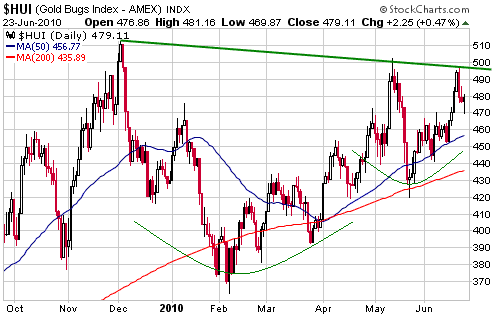
The following two HUI charts look almost identical, even though the
first is a daily chart covering the past 9 months and the second is a
weekly chart covering the past 3.5 years. Both charts appear to have
traced out what technical analysts often refer to as a "cup and
handle", a consolidation pattern that tends to resolve bullishly.
(Note: If the HUI holds above 460 during the coming days and then rises
to the 490s, there will also be a "cup and handle" pattern evident on
an hourly chart covering the past 2 months.)
The measured objective following an upside breakout on the daily chart
would be 630, while the measured objective following an upside breakout
on the weekly chart would be 850. In our opinion, consecutive daily
closes above 505 would constitute an upside breakout on the daily
chart, and a weekly close above 520 would constitute an upside breakout
on the weekly chart.
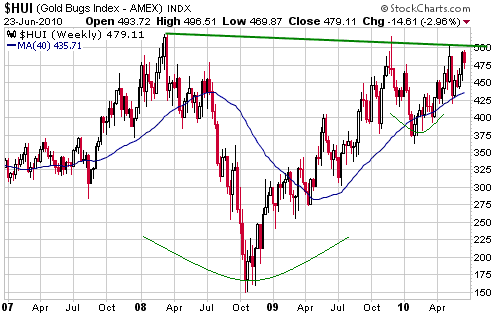
Our favoured scenario
is that the HUI will test its February low -- most likely during the
final quarter of this year -- before commencing its next
intermediate-term advance. This scenario is not inconsistent with the
idea that the weekly chart is forming a "cup and handle" pattern, the
reason being that the "handle" could encompass a double bottom at
around 370. However, it is inconsistent with the idea that the daily
chart is forming a "cup and handle".
We have been intermediate-term "neutral" on the HUI for the past 9
months, a period during which this index chopped back and forth and
achieved an insignificant net gain of about 7%. Regardless of whether
or not the HUI is destined to re-visit its February low at some point
over the next few months the time has come to upgrade our
intermediate-term outlook to "bullish", because looking ahead 12 months
there is clearly now a lot more upside potential than downside risk.
As is often the case, the short-term risk/reward is not as clear.
Speculators could operate on the assumption that the short-term outlook
was turning bullish, using a HUI close below 460 or a gold futures
close below $1220 as a 'stop'. Alternatively, they could reasonably
decide to remain agnostic with regard to the short-term, with a large
'core' position based on the bullish long-term outlook and no positions
that require the market to do anything in particular over the next
couple of months. Exposure could then be ramped up and/or hedges
jettisoned following consecutive daily closes above 505. We are taking
the latter approach.
Gold Stock Valuations
We will include updated versions of our gold stock value comparison tables in the coming Weekly Update.
Currency Market Update
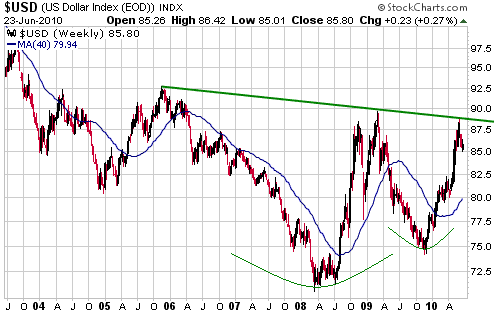
We just talked about the "cup and handle" patterns being traced out by
the HUI over different timeframes. Interestingly, the following chart
shows that the Dollar Index could also be forming such a pattern -- on
a long-term basis.
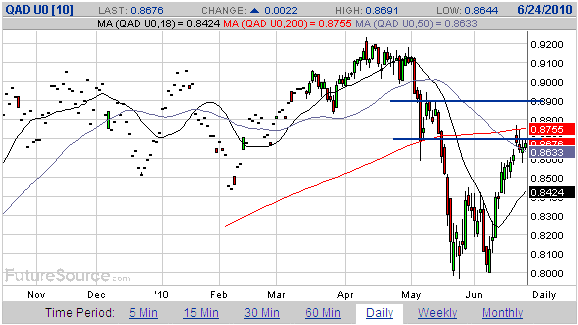
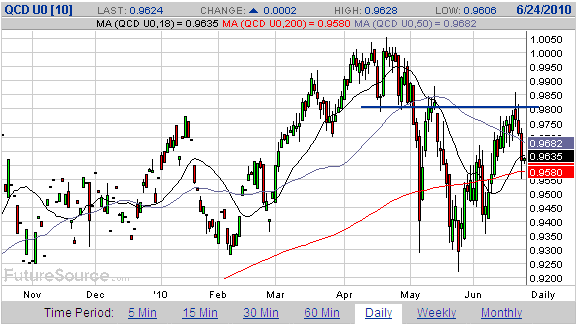
From the email alert sent early this week:
"In the 14th June Weekly
Update we cited 0.88 and 0.98 as, respectively, reasonable targets for
the rebounds in the A$ and the C$. These targets were reached near the
start of US trading on Monday. We took advantage of the China-related
'pop' in commodities and the commodity currencies to purchase some FXA
December-2010 put options as a partial hedge on our long-side exposure
to the A$. Our plan, at this stage, is to buy some more A$ puts if
there is additional strength over the next few weeks."
Daily charts of the September A$ and C$ futures are displayed below.
For the A$, the resistance that extends from 0.87 to 0.89 is currently
being probed. The C$ has reversed downward after testing resistance at
0.98.
Update
on Stock Selections
(Notes: 1) To review the complete list of current TSI stock selections, logon at http://www.speculative-investor.com/new/market_logon.asp
and then click on "Stock Selections" in the menu. When at the Stock
Selections page, click on a stock's symbol to bring-up an archive of
our comments on the stock in question. 2) The Small Stock Watch List is
located at http://www.speculative-investor.com/new/smallstockwatch.html)
Chart Sources
Charts appearing in today's commentary
are courtesy of:
http://stockcharts.com/index.html
http://www.futuresource.com/

|