![]()
![]()
![]()
![]()
- Interim Update 23rd September 2020
Copyright
Reminder
The commentaries that appear at TSI
may not be distributed, in full or in part, without our written permission.
In particular, please note that the posting of extracts from TSI commentaries
at other web sites or providing links to TSI commentaries at other web
sites (for example, at discussion boards) without our written permission
is prohibited.
We reserve the right to immediately
terminate the subscription of any TSI subscriber who distributes the TSI
commentaries without our written permission.
The Stock Market
In theory, a US Supreme Court
Justice is an impartial judge of the legality and constitutionality of court
decisions, government statutes and presidential directives. In practice,
however, each Supreme Court Justice is influenced by his/her political
leaning. As a result, a vacancy on the Supreme Court of the United States
is viewed as an opportunity for the party with the power to nominate the
replacement (in the current case, the Republican Party) and a threat to
the other major party. Consequently, the process of nominating and
confirming a new Supreme Court Justice can be acrimonious and get in the
way of agreements on other issues.
That's why the death last Friday
of Supreme Court Justice Ginsburg has reduced the probability of the
Republican and Democratic parties striking a pre-election stimulus deal.
The nomination/selection of a new Supreme Court Justice would be
contentious at the best of times, but at the moment it is even more so
because it is happening shortly before an election that will itself be
contentious.
The reduced probability of a pre-election stimulus
deal increases the US stock market's short-term downside risk, but we
continue to think that the most likely outcome is a normal correction. For
the SPX, a normal correction would encompass a test of the 200-day MA. The
following chart shows that the 200-day MA is about 130 points (4%) below
Wednesday's closing price.
A normal correction is being signalled by the Volatility Index (VIX).
As illustrated by the following chart, the VIX's performance over the past
month looks similar to its performance during the June correction. That's
despite the current correction being larger than the June correction in
terms of the SPX's peak-to-trough decline.
Note that if the VIX
were to return to near its early-September high within the next two weeks
then the similarity with the June-July period would disappear. This would
warn that something more bearish than a normal correction was in progress.
Apart from the reduced probability of a pre-election stimulus deal,
there are two reasons to be concerned that the decline from the
early-September peak could develop into something more bearish than a
normal correction.
The first reason is the performance of the NYSE
Advance-Decline Line (ADL), which is shown in the lower section of the SPX
chart presented above. Unlike the June correction, the September
correction was preceded by a bearish divergence between the SPX and the
ADL. Also, the ADL has been weaker during the current corrective period
than it was in June.
The second reason is that there has been far
more weakness in the mega-cap tech stocks since the early-September peak
than there was during the weeks following the early-June peak. The
difference is obvious on the following daily chart of the NASDAQ100 Index
(NDX). The chart shows that the NDX's upward trend hardly even paused for
breath during June, whereas the decline from the September peak looks like
trend reversal. At best, this is signalling an intra-market leadership
change.
We reiterate that a normal correction (maximum 4% additional downside
for the SPX) is considered the most likely outcome, but at the same time
we acknowledge the risk that something more bearish will happen. Something
more bearish for the stock market probably would go hand-in-hand with the
Dollar Index reaching the top of our upside target range (98).
Gold and the Dollar
Gold
Gold has broken decisively below support at US$1920. This suggests that
the price could fall as far as lateral support in the low-$1700s before a
correction low is in place, although there is lateral support near $1800
that could act as a floor. Gold also has broken out to the downside in
euro terms.
If there is a rebound attempt over the final two days
of this week it probably will be limited by the $1920 level that was
tested numerous times before being breached on Monday of this week. In
other words, former support is now resistance.
The fundamental backdrop remains bullish for gold. This indicates that
we are dealing with a correction within the context of a multi-year
advance and not the start of major downward trend.
This week's
breakdown suggests that a correction low will be set within the coming
month and could be set as soon as next week. If so, the US$ gold price
probably will be making new highs by early next year.
Silver
In the latest Weekly Update we noted that the US$
silver price had barely moved during Tuesday-Friday of last week, but that
it appeared to be slowly forming a short-term top. The topping
interpretation was confirmed in no uncertain terms on Monday of this week.
Monday's 10% plunge in the silver price left the $26.00 demarcation
level in the dust. Wednesday's 6% plunge then added to the damage by
taking out the early-August low.
The bad news is that significant short-term downside risk remains. The
good news is that this week's dramatic increase in volatility could result
in the silver market reaching a correction low as soon as next week.
As mentioned in previous TSI commentaries over the past two months,
silver has short-term downside risk to the vicinity of the 200-day MA
(around US$19.00). Despite that still being the case, we took profits on
half of our SLV put options on Wednesday 23rd September. This was done to
ensure that whatever happens from here, we end up with a sizable profit on
the position. Also, we plan to take profits on the balance of our SLV puts
if lateral support at around $21.00 for silver futures is reached within
the next several days. The reason is that even though the decline could
extend to $19, at $21 or lower silver's short-term risk/reward would be
bullish.
Gold Stocks
In the email sent to
subscribers in response to Monday's market action, we wrote:
"The
HUI must close below 320 to confirm that the August-September cycle worked
this year (for the sixth year in a row). It didn't do that on Monday 21st
September, but there's a risk that it is tracing out a crash pattern and
will plunge within the next two weeks."
A crash pattern
involves an initial decline from an intermediate-term high, followed by a
rebound or consolidation that can retrace up to 100% of the initial
decline and then a second decline that transforms into a crash after the
low of the initial decline is breached. Most crash patterns don't end in
actual crashes, but to get a crash a market usually has to go through the
sequence outlined above.
In the current case of the HUI, a sharp
initial decline from the early-August high of 374 to a low of 320 was
followed by several weeks of consolidation that retraced about 75% of the
initial decline. In the email sent earlier this week we were referring to
the risk that taking out 320 would set off a crash.
Support at 320
was taken out on Wednesday 23rd September.
We aren't expecting a
bona fide crash, but, as mentioned numerous times over the past several
weeks, we do think there is a realistic chance of the HUI trading as low
as the 260s before its correction ends.
We generally advocate scaling in on weakness, but not randomly. The
current situation is that the gold mining indices/ETFs a) have just broken
below important support levels, b) are well above the next important
support levels, and c) are not yet oversold. Therefore, right here and now
there is no good reason to buy for a short-term trade. If you buy for a
short-term trade at this time you may get lucky, but relying on luck is
not a good strategy.
We would be sceptical regarding the
sustainability of any rebound that started from near the current level. If
an attempt to rebound is made over the coming 1-2 days then former support
for the HUI in the 320s probably would act as resistance.
Our guess
at this time is that a correction low for the gold mining sector will be
in place by the end of next week, but we'll take the evidence as it comes.
The Currency Market
The Dollar Index (DX) and the euro
Much of what will happen
in the financial world over the coming 1-2 months hinges on the US$. The
world seems very different when the DX is trending upward than it does
when the DX is trending downward.
In the latest Weekly Update, we
wrote:
"While there is a risk that the currency-market action
of the past seven weeks will prove to be nothing more than a pause to the
short-term trend that got underway in May, we think that the DX's
performance since late-July looks like a basing pattern and that the
euro's performance over the same period looks like a topping pattern."
Due to what happened over the first three trading days of this week we
can now be certain that the price action of the past two months involved
basing for the DX and topping for the euro. As previously advised and with
reference to the daily charts displayed below, the DX should rise to 95-96
and could rise to 97-98 before resuming its longer-term decline, while the
euro should drop to around 115 and could trade as low as 112 before
resuming its longer-term advance.
We plan to exit at least half of
our euro (FXE) put options if the euro reaches 115 within the next two
weeks.
The Commodity Currencies
We
have focussed on the Australian dollar (A$) over the past six months
because it was considered to be the major currency that would benefit the
most from a cyclical rise in commodity prices. We also have noted that the
Canadian dollar (C$) should benefit from the rise in commodity prices,
albeit to a lesser extent due to the tendency for the C$ to be weak
relative to the A$ during multi-year periods when the Dollar Index is
weak.
The C$ is being singled out for discussion today because the
latest Commitments of Traders (COT) report revealed a sentiment extreme
associated with the positioning of NonReportable (a.k.a. small) traders in
C$ futures. We are referring to the fact that the net-long position of the
NonReportable traders recently rose to near its highs of the past 9 years,
implying that the 'dumb money' recently became as bullish about the C$ as
it usually gets.
The following weekly chart shows that every other
time over the past eight years that the NonReportable traders in C$
futures were as 'long' as they were last week, the C$ was close to a peak
of at least short-term significance.
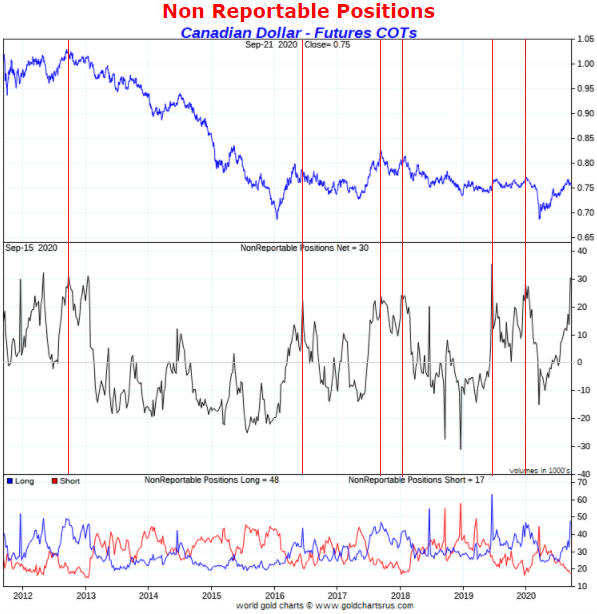
We think that the C$ and the A$ have commenced 1-3 month corrections
within 1-2 year upward trends. For the C$, a normal correction would
result in a decline to around 73.
For the A$, a normal correction would result in a decline to around
68.
Updates on Stock Selections
Notes: 1) To review the complete list of current TSI stock selections, logon at
http://www.speculative-investor.com/new/market_logon.asp
and then click on "Stock Selections" in the menu. When at the Stock
Selections page, click on a stock's symbol to bring-up an archive of
our comments on the stock in question. 2) The Small Stock Watch List is
located at http://www.speculative-investor.com/new/smallstockwatch.html
![]() Introducing
Aeris Resources (ASX: AIS). Shares: 1873M issued, 1967M fully diluted.
Recent price: A$0.052.
Introducing
Aeris Resources (ASX: AIS). Shares: 1873M issued, 1967M fully diluted.
Recent price: A$0.052.
AIS is an Australia-based
copper-gold producer with a current market cap of about A$95M. The company
has working capital of A$37M and long-term debt of A$68M, meaning that its
net debt is A$31M and its EV (market cap plus net debt) is A$126M. The
debt figure includes a payment of A$15M due to Evolution Mining on 30th
June 2022, but we haven't included contingent payments of up to A$50M due
to Evolution Mining during the period from 1st July 2022 to 30th June
2027. The payments to Evolution are linked to AIS's purchase of
Evolution's Cracow gold mine three months ago.
During the financial
year ending 30th June 2021, AIS expects to produce about 70K ounces of
gold at its Cracow mine in Queensland and 53M pounds of copper at its
Tritton mine in NSW. At US$1900/oz for gold and US$3.00/pound for copper,
the FY2021 production guidance results in revenue of around US$292M
(A$390M), 54% of which is copper-related and 46% of which is gold-related.
We are interested in AIS mainly for its copper production, but the gold
production reduces risk.
The projected FY2021 cash costs are
US$735/oz for gold and US$2.17/pound for copper, assuming an average
A$/US$ exchange rate of 0.75. This means that the production should be
very profitable.
With A$390M of profitable annual revenue AIS would
be worth A$0.19/share even if it were only valued at 1-times revenue. Why,
then, is the market currently valuing the stock at A$0.052?
The
reason is that the company's two operating mines have short reserve lives.
Specifically, at 31st December Cracow had only 114K ounces of gold
reserves and Tritton had only 220M pounds of copper reserves, meaning that
Cracow currently has only 1-2 years of remaining life and Tritton has only
4 years of remaining life. However, AIS's management expects that
sufficient additional reserves will be proved-up to enable the lives of
both mines to be extended by several years. Given the historical
performance, this appears to be a reasonable expectation. For example,
Cracow has produced 80K-100K ounces of gold per year for a great many
years without ever having more than 273K ounces of P&P gold reserves.
From an investing/speculating perspective, the opportunity is that the
company will do enough to convince the market that substantial mine-life
extensions are likely. This could result in a 200%+ increase in the AIS
stock price with no change in metal prices. At the same time, the low
current valuation mitigates the downside risk.
There are three
other parts of the AIS story worth highlighting at this time.
The
first is that the company has hedged, via forward sales, about half of its
production between now and July-2021. The hedging was done at slightly
above current metal prices and should ensure that cash flow is strongly
positive over the next three quarters, but we would view it as a negative
if the company were to engage in additional hedging. Most people buy the
stocks of copper and gold miners for leverage to copper and gold prices,
not for steady cash flow.
The second is that AIS has a $256M
carried-forward tax loss on its balance sheet that could be used to offset
future taxes. This will be a valuable asset if the company becomes very
profitable.
The third is that the AIS share structure and share
price are not appropriate for a company with AIS's assets. This issue
could be resolved via a 1-for-10 or 1-for-20 share consolidation.
The AIS stock price has fallen by more than 20% over the past two weeks
and has returned to intermediate-term lateral support. Despite the overall
market risk, this is a reasonable price level to start scaling into the
stock.
We have added AIS to the TSI List as an intermediate-term
trading position, but depending on what happens over the next few months
we may end up making it a long-term position.
Chart Sources
Charts appearing in today's commentary
are courtesy of:
https://stockcharts.com/
http://www.goldchartsrus.com/
http://bigcharts.marketwatch.com/
![]()