![]()
![]()
![]()
![]()
- Interim Update 23rd November 2016
Copyright
Reminder
The commentaries that appear at TSI
may not be distributed, in full or in part, without our written permission.
In particular, please note that the posting of extracts from TSI commentaries
at other web sites or providing links to TSI commentaries at other web
sites (for example, at discussion boards) without our written permission
is prohibited.
We reserve the right to immediately
terminate the subscription of any TSI subscriber who distributes the TSI
commentaries without our written permission.
The long-term bottom
for interest rates
The yields on long-dated US
Treasury debt have made significant gains since bottoming 4-5 months ago.
Due to emerging evidence of "price inflation" and the expectation of more
"price inflation" to come, they are likely to comfortably exceed this
year's highs during 2017. However, for the three reasons outlined below a
major rise in interest rates is more likely to be next decade's story than
a story for the next 1-2 years.
The first reason is that the US
stock market's valuation can only be justified if the assumption is made
that US government bond yields will remain at 2% or lower forever. If the
10-year yield moves up to 3% then this assumption will be exposed for the
silliness it is, prompting a substantial downward re-rating of the stock
market. A large stock-market decline would, in turn, drive the 10-year
interest rate back down as part of a flight to safety. In other words,
interest rates will probably be capped over the next couple of years by
the effects that higher interest rates would have on equity valuations.
Another reason is that the US economy is likely to enter its next
recession in 2017. While it wouldn't be unprecedented for interest rates
to rise during a recession (they rose during the 1973-1974 recession, for
example), with debt levels at or near historic highs it's far more likely
that a 2017-2018 recession would be accompanied by falling inflation
expectations, increasing demand for money and a shift towards the
perceived safety offered by US Treasury debt.
A third reason to
expect the US 10-year yield to be capped at around 3% for at least the
next couple of years is the tendency for long-term rising trends in
interest rates to end via blow-off moves (as per the early-1920s and the
early-1980s) and for long-term falling trends in interest rates to end via
many years of basing. To show what we mean, here's a very long-term chart
of the US 10-year yield.
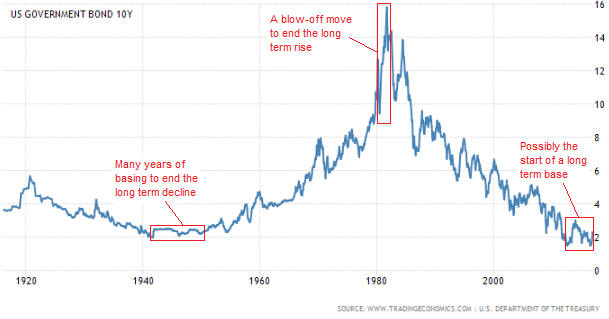
The historical sample size is admittedly very small, but if the
current long-term declining trend ends in a similar way to the previous
long-term declining trend then the US 10-year T-Note yield will spend a
few more years in a range bounded by the 2012 low at around 1.4% and the
2013 high at around 3.0%.
Here's a short-term chart showing the
potential trading range assuming that the secular interest-rate trend is
in the process of shifting from down to up.
If we are right, then interest-rate moves will be difficult to trade
over the next couple of years. Profiting from the swings will require very
good timing.
Oil Update
As discussed in a
post at the TSI Blog earlier this week, a sizable gap between the oil
price and the Canadian Dollar (C$) has again opened up. There is no
guarantee that this gap will be closed via a decline in the oil price, as
it could also be closed via a rally in the C$. There's also no guarantee
that it will be closed at all. However, the historical record suggests
that the gap will be closed and that it will happen via weakness in the
oil price.
The upshot is that we are being presented with a new
opportunity to speculate on a lower oil price or to hedge
commodity-related long positions via oil (USO) put options.
Primarily for hedging purposes, we have begun to average into a position
in USO February-2017 $10 put options and expect to have a full (albeit
small) position within two weeks. We chose February options because
cyclical/seasonal factors suggest that January-February is the most likely
time for the next multi-month bottom in the oil price.
The Stock Market
The US
The S&P500 Index (SPX) has followed the Dow Industrials Index into new
high territory. It must end the week above the August high of 2194 to
confirm the breakout, but with only half a day of US trading left in this
week (due to Thanksgiving, the US market is closed on Thursday and open
for only half a day on Friday) it is likely to do so.
The NASDAQ100
Index (NDX), however, is still trading below its September and October
highs.
A significant pullback over the next few weeks is certainly possible,
but every technical indicator we track now points to a 6-12 month
extension to the US equity bull market. This doesn't mesh with what's
happening on the earnings front or with most economic indicators, although
it is consistent with the acceleration in the pace of money-supply growth
over the past two months.
Greece
Despite
the fact that Greece is widely perceived to be an economic basket-case,
it's now worth considering an intermediate-term bullish speculation on
Greece's stock market via the Global X MSCI Greece ETF (GREK). Even though
this ETF is US$-denominated and has therefore been pressured downward over
the past few months by weakness in the euro, it has broken above a
downward-sloping trend-line that originates way back in early-2015 and
appears to be in the process of tracing out an intermediate-term basing
pattern. The top of the base is near $9.00.

The economic problems facing Greece are substantial. They are also
very well known, which is why Greek equities have very low valuations on
average. For example, the
ETF Research Centre indicates that GREK is trading at only 0.3-times
book value. By way of comparison, the S&P500 trades at 2.7-times book
value and the euro-zone average is about 1.4-times book value.
Almost any asset can be a good investment or a bad investment. It all
depends on the price.
We have begun to average into GREK in our own
account and will probably add it to the TSI List if it pulls back to
around $7.50.
Gold and the Dollar
Gold
The
US$ gold price has broken below trend-defining support in the low-$1200s.
If the break below $1200 is confirmed by the weekly close it will be
another nail in the coffin of the bull-market scenario.
Gold's main problem is bearish fundamentals. At no time during the
rally from the December-2015 low were the fundamentals definitively
bullish, and right now they are more bearish than they have been in years.
Very few long-term gold bulls understand this. They look at what
central banks are doing and automatically assume that the fundamental
backdrop is gold-bullish, but gold's fundamentals are determined by the
expected effects of monetary policies rather than the actual efficacy of
the policies. To put it another way, gold's fundamentals are determined by
monetary and economic confidence rather than the actual ability of a
policy course-of-action to have a positive effect. This may seem vague,
but monetary/economic confidence and expectations can be measured by
quantities such as credit spreads, the TIPS yield, the yield curve, and
the bond/dollar ratio.
As mentioned in the latest Weekly Update,
the good news for gold 'longs' is that some of gold's most influential
fundamental price drivers are stretched beyond normal bounds in a
gold-bearish direction. This makes it likely that the downward pressure
will soon dissipate, potentially enabling a significant rebound. We
mentioned, for example, that both the T-Bond and the Dollar Index were
very extended -- to the downside for the T-Bond and to the upside for the
Dollar Index -- on a short-term basis, making it likely that the
bond/dollar ratio will soon begin to rebound.
The bond/dollar ratio
became even more stretched in a gold-bearish direction during the first
half of this week, but the same analysis applies.
Also stretched
beyond normal bounds on a short-term basis is the Yen, a fact that we are
mentioning in the "Gold" section of today's report because the Yen is the
currency that over the past several years has had the strongest
correlation with gold. Just as the low-$1200 area was a likely target for
a bottom in the gold price and just as gold is spiking below this
important support range, the 89-90 area was a likely target for a bottom
in the Yen and the Yen has just spiked below this support range.
The extent to which the Yen is stretched to the downside on a short-term
basis is evidenced by the RSI(14) displayed at the bottom of the following
daily chart. A daily RSI(14) as low as 17 is rare.
Silver
We just wanted to point out that the
silver price is now very close to important lateral support at $16.00,
which for the past few months has been considered the most likely level
for a correction low.
There is no longer a good chance of $16.00
being the final bottom for the correction/downturn that began in July, but
this is a price area from which a multi-week rebound will potentially
begin.
Gold Stocks
In reaction to gold's break below
$1200, the HUI traded at its lowest level in more than 7 months and
dropped back to the bottom of its well-defined price channel on Wednesday.
Interestingly, however, it didn't close below its 14th November intra-day
low. There is therefore still a hint of a bullish non-confirmation between
gold bullion and the associated mining stocks.
It's worth repeating the following two paragraphs from the latest
Weekly Update, because although the gold price has broken below support at
$1200 the overall situation is not materially different:
"If a
turn to the upside doesn't happen immediately it will probably do so
before the end of November. This is not only because the gold-mining
indices are 'oversold', but also because the short-term blow-off moves in
T-Bonds and the US$ (the source of the current downward pressure on
gold-related investments) will soon exhaust themselves.
The rebound
that follows the coming short-term reversal could last a few weeks and
could be strong enough to create the impression that a new
intermediate-term upward trend has begun, but the price action of the past
two weeks has increased our conviction that the overall correction/decline
won't end before the first quarter of next year."
The
Currency Market
After a small pullback on Monday, the
Dollar Index continued its relentless up-move on Tuesday and Wednesday. It
has now risen on 12 of the past 13 trading days.
Despite the Dollar
Index's clear-cut break to new multi-year highs, none of the Dollar
Index's component currencies has made a new multi-year low. Of particular
relevance given that it is almost 60% of the Dollar Index, the euro hasn't
yet traded below its March-2015 bottom.

There's a good chance that the euro will not only trade below its
March-2015 bottom but also drop below parity with the US$ during the first
few months of next year. However, it is probably close to its low for this
year.
Updates on Stock Selections
Notes: 1) To review the complete list of current TSI stock selections, logon at
http://www.speculative-investor.com/new/market_logon.asp
and then click on "Stock Selections" in the menu. When at the Stock
Selections page, click on a stock's symbol to bring-up an archive of
our comments on the stock in question. 2) The Small Stock Watch List is
located at http://www.speculative-investor.com/new/smallstockwatch.html
Chart Sources
Charts appearing in today's commentary
are courtesy of:
http://stockcharts.com/index.html
http://www.tradingeconomics.com/
![]()