![]()
![]()
![]()
![]()
- Interim Update 24th February 2016
Copyright
Reminder
The commentaries that appear at TSI
may not be distributed, in full or in part, without our written permission.
In particular, please note that the posting of extracts from TSI commentaries
at other web sites or providing links to TSI commentaries at other web
sites (for example, at discussion boards) without our written permission
is prohibited.
We reserve the right to immediately
terminate the subscription of any TSI subscriber who distributes the TSI
commentaries without our written permission.
Oil Update
The life and death of an
investment bubble
The following chart shows the life and death of an investment bubble.
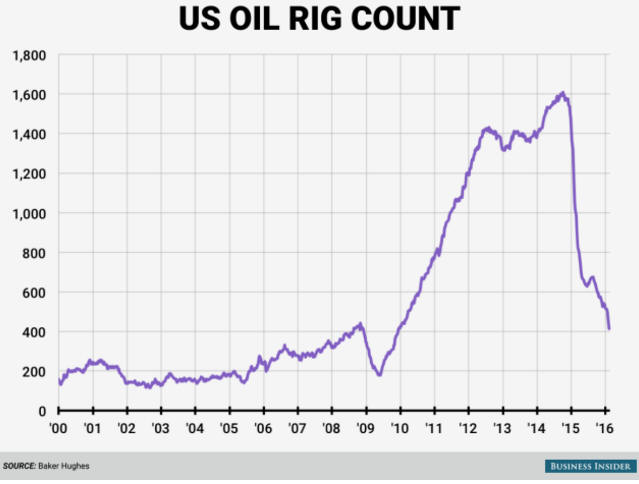
The inflation of the bubble during 2009-2014 was due to money-pumping and other
central-bank policies. More specifically, it was caused by the combination of
rapid monetary inflation in many countries, most notably China, leading to
unsustainably-high demand for oil and a very high price for oil, and by Federal
Reserve policies that led to artificially-low interest rates and a frantic
search for yield in the US. Since the price of oil did not accurately reflect
sustainable demand, when demand began to fall the massive investment in new
supply was revealed to be what "Austrian" economists call mal-investment. The
bubble deflated.
As is always the case, the gains achieved during the bubble period proved to be
ephemeral and resources were wasted on a grand scale. Furthermore, the full cost
of the wastage will never be known, because it is only possible to 'see' the
losses in the shale-oil and related businesses. It will never be possible to see
what would have been if the price system had been allowed to work, that is,
there will never be any way of knowing the productive investments that would
have been made if the intervention-crazy Fed had not unwittingly implemented
policies that channeled far too many resources into the development of shale-oil
fields.
Most disturbingly, there is no recognition within the halls of central banking
and very little recognition within the ranks of mainstream economists and
financial journalists that the problems now being encountered by the oil
industry are primarily due to the falsification of prices by central banks.
Janet Yellen seems to believe that all problems facing the US economy stem from
outside the US and that the Fed has done almost everything right. The Fed has
certainly done everything by the book. The problem is that the book is
completely wrong.
A consequence of there being almost no understanding in the central-banking
world of the economic damage wrought by the falsification of prices is that the
deliberate policy of price falsification is bound to continue unabated. This is
as close to a certainty as you will get in the financial world. The difficulty
is in figuring out the short- and intermediate-term effects of the policy.
Current Market Situation
The collapse in the quantity of drilling rigs operating in the US oil industry
hasn't yet had a big effect on production, but it eventually will. If it doesn't
happen this year it will happen next year. Moreover, the market price will begin
to discount a more bullish supply-demand situation well before it becomes
apparent in the production data.
US oil production is going to decline, but this is not the only reason we expect
a significantly higher oil price within the coming 12 months. In addition there
is the on-going central-bank policy that entails fomenting a new bubble in an
effort to mitigate the short-term pain stemming from the bursting of an earlier
bubble, and the likelihood that before this year is over the market will be
prompted to factor a higher risk of a Middle-East oil-supply disruption into
current prices.
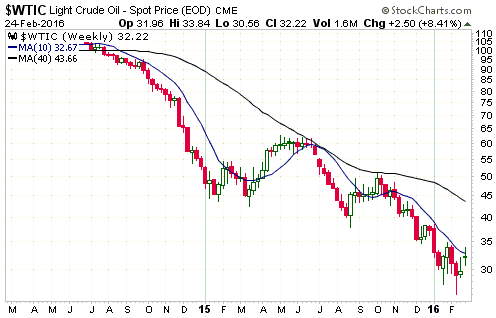
One of the first signs that the oil price has bottomed on an intermediate-term
basis will be a weekly close above the 10-week MA (the blue line on the
following chart). A more conclusive, although less timely, sign of a sustainable
bottom will be a weekly close above the 40-week MA (the black line on the
following chart). Notice that both of last year's rallies ended exactly at the
40-week MA.
The Stock Market
The US
Revisiting the relevant comparison
As explained a few times last year and most recently in the 13th January Interim
Update, we think it makes more sense to compare 2015-2016 with 2000-2001 than
with 2007-2008. This is because the present-day fundamental, monetary, sentiment
and technical backdrops all have more in common with 2000-2001 than with
2007-2008. In particular, both 2000 and 2015 had a strong dollar, very weak
markets for gold and gold-mining stocks, widespread belief that the US economy
was by far the world's strongest, a Federal Reserve making small steps towards
tighter monetary conditions, and an investment boom in large-cap tech stocks. It
is also because a new bear market is unlikely to evolve along the lines of the
most recent preceding example (the one that is freshest in everyone's mind).
Here is an updated version of a chart-based comparison we showed multiple times
over the past 12 months. We initially showed this comparison during the first
half of last year to make the point that there was an upside breakout in the
NYSE Composite Index (NYA) shortly before a major top in 2000 and that the same
thing could be in store this time around.
As it turned out, the NYA broke out to the upside last May-June and has since
performed similarly to how it performed during the months following 2000's false
upside breakout.
We stated in our 13th January commentary that if the similarity persisted then
there would be a short-term bottom during the first quarter of this year. The
similarity has persisted, so that's still the case. Moreover, the 11th February
price action (the SPX's quick spike below its January low) and the
sentiment-related evidence outlined in the latest Weekly Update suggest that the
short-term bottom expected for Q1 is already in place.
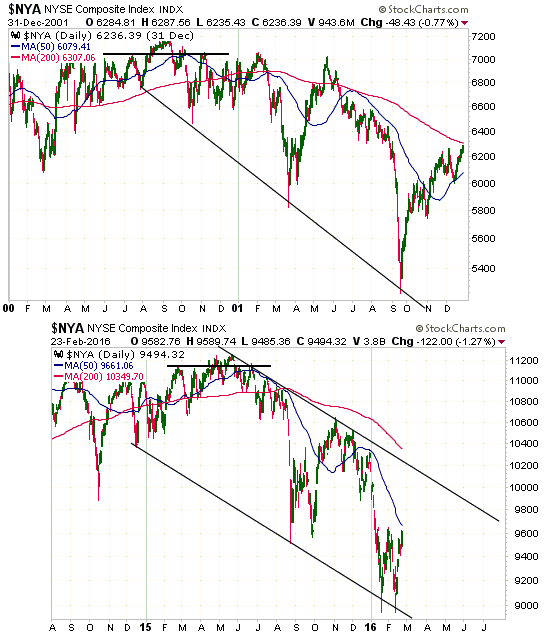
Comparisons such as the one shown above can be visually appealing, but they
should never be relied on. Every cycle has significant differences and we can be
confident that even though the current market is presently following roughly the
same path as 2000-2001, at some point it will deviate.
Such comparisons can, however, provide legitimate clues as to what's possible in
the future. Taking the 2000-2001 analogy along with the sentiment backdrop and
the extent to which the stock market was 'oversold' during the week before last,
we should be open to the possibility that there will be a rebound to the 200-day
MA or perhaps even a little higher within the coming three months.
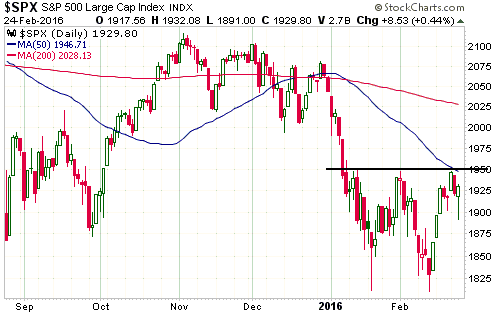
Current Market Situation
In the latest Weekly Update we said that S&P500 (SPX) resistance at 1950 would
probably soon be tested. It was tested the next day, after which there was a
routine 1-2 day pullback.
It is reasonable to expect that the 1950 resistance level will be breached
within the next couple of weeks. Assuming it is breached, the next upside target
will be the more important lateral resistance that lies at 1990-2000. Getting
through this resistance would likely result in an extension of the rebound to
near the 200-day MA (currently at 2028, but slowly declining).
Our guess is that the overall rebound from the January-February double bottom
will continue in fits and starts until the SPX reaches the vicinity of its
200-day MA. However, we are certainly open to other possibilities and will take
the evidence as it comes.
Gold and the Dollar
Gold
Here's how we concluded the gold discussion in the latest Weekly Update:
"Although it is not something we would bet on, with support at $1190 having
passed its first test and with the COT situation not yet bearish a quick move to
a new high for the year is a realistic possibility. Round-number resistance at
$1300 and the January-2015 peak at $1308 will be obvious near-term targets if
the February high of $1264 is breached."
There was considerable volatility in the gold market over the first three days
of this week and a potentially significant downward reversal on Wednesday 24th
February, but the situation is not materially different now than it was at the
end of last week. The gold market remains 'overbought' and it is possible that a
short-term top was put in place on 11th February when the price spiked up to
$1264, but a short-term top hasn't yet been clearly signaled.
As previously advised, a daily close below $1190 would be a clear signal that a
short-term top was in place. Also, the 20-day MA has moved up to the $1180s and
will be above $1190 by the end of this week. Once it moves above $1190 a daily
close below the 20-day MA could reasonably be interpreted as confirmation of a
short-term top.
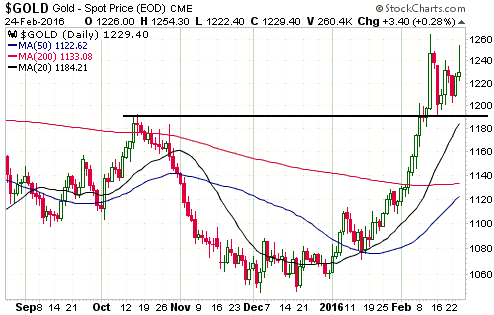
Until a short-term top is signaled via a daily close below $1190 and/or the
20-day MA there will be a realistic chance of a rise to the resistance that lies
at $1300-$1308. This resistance, in our opinion, defines the maximum
daily-closing upside potential with regard to the coming two months, although it
is likely to be breached within the coming 6 months.
Whether or not the gold price makes a new high for the year in the near future
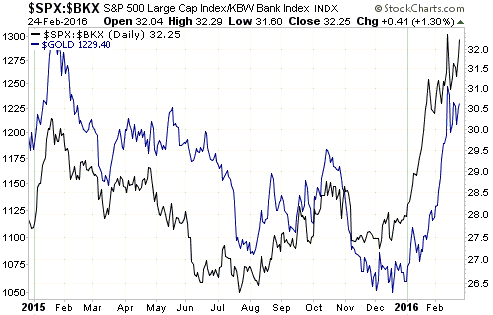
will be strongly influenced by the relative strength of the banking sector. The
reason is that the relative strength of the banking sector, as indicated by the
SPX/BKX ratio (the S&P500 Index divided by the Bank Index), has been the gold
market's dominant fundamental price driver over the past 12 months.
The chart displayed below shows that the recent sharp rise in the US$ gold price
followed closely behind a sharp rise in the SPX/BKX ratio, which was the result
of a mini panic out of bank stocks. The chart's message is that for gold to
extend its rally the banking sector will have to continue weakening.
Additional relative weakness in bank stocks is a good bet with regard to the
coming 12-24 months, but it won't surprise us if bank stocks rebound in absolute
and relative terms over the coming 1-2 months.
Gold Stocks
Current Market Situation
Although the US$ gold price peaked two weeks ago and is now more than $30 below
its 11th February intra-day high, the HUI has continued to push upward and made
a new high for the year on Wednesday 24th February. On a short-term basis it
remains as 'overbought' as it ever gets, but it hasn't yet signaled that a
short-term top is in place. To put it another way, the warning bells of a
correction are ringing loudly, but there is no evidence yet that the correction
has begun.
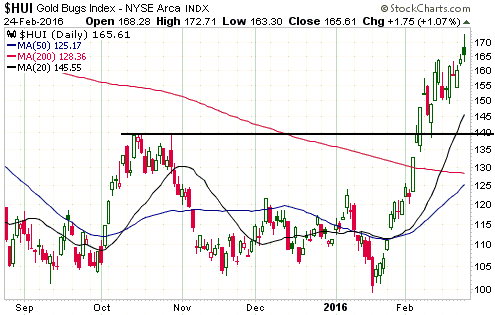
We can be sure that there will be a correction that causes the HUI to trade at
or below its 50-day MA within the coming three months. The unknown is where the
50-day MA will be when it hits the current price. The longer it takes for the
50-day MA to intersect the current price, the higher the level at which the
intersection will occur.
For example, the 50-day MA is now at 125, but at the rate it is rising it will
be around 140 by the end of next month. It is possible, therefore, that a
multi-week correction could hold at or above lateral support at 140 and also
touch the 50-day MA.
The evidence continues to build that a short-term top is close at hand AND that
a bull market has begun. In addition to the evidence cited in recent
commentaries, this includes the performance of the HUI/gold ratio.
Due to the dramatic strength in gold-mining stocks relative to gold bullion over
the past six weeks, the HUI/gold ratio is now about 20% above its 40-day MA.
This is illustrated below. At the same time as it points to gold-mining stocks
being stretched to the upside on a short-term basis relative to gold bullion,
this situation has longer-term bullish implications. The reason is that the only
other occasions over the past 16 years when the HUI/gold ratio was 20% or more
above its 40-day MA happened during 2001-2002 (the first two years of a bull
market) and late-2008 (the first two months of a multi-year rally).
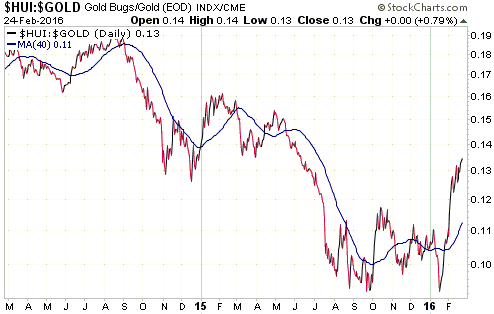
The historical record suggests that the HUI/gold ratio will drop to its 40-day
MA or lower within the coming three months, before resuming its advance.
What are we doing with our gold-stock portfolio?
We did a minor amount of selling on Wednesday 24th February and still have three
small-scale above-the-market sell orders in place, but we have essentially
retreated to our 'core' gold-mining exposure and will not do much more selling
of gold stocks unless things get crazy on the upside.
We are now 40%-45% in cash, which is as high as we want to go. Some of this cash
will be put to work by scaling into non-gold (oil, gas and industrial-metal)
commodity stocks, a process that has already begun and that has been reflected
in TSI commentaries over the past couple of weeks.
Also, we have begun to scale into GDX put options to partially hedge our core
exposure to the gold-mining sector. We will be happy to write-off these
insurance puts if it turns out that they aren't needed.
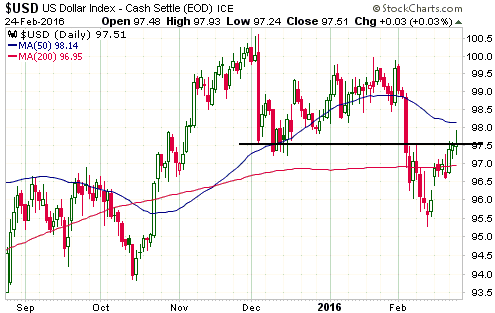
The Currency Market
The Dollar Index tested resistance at 97.5 on each of the first three trading
days of this week. If it ends the week above this resistance it will greatly
reduce the probability of a decline to the low-90s prior to the start of a rally
to new highs.
Updates on Stock Selections
Notes: 1) To review the complete list of current TSI stock selections, logon at
http://www.speculative-investor.com/new/market_logon.asp
and then click on "Stock Selections" in the menu. When at the Stock
Selections page, click on a stock's symbol to bring-up an archive of
our comments on the stock in question. 2) The Small Stock Watch List is
located at http://www.speculative-investor.com/new/smallstockwatch.html
Chart Sources
Charts appearing in today's commentary
are courtesy of:
http://stockcharts.com/index.html
![]()