|
- Interim Update 24th March 2004
Copyright
Reminder
The commentaries that appear at TSI
may not be distributed, in full or in part, without our written permission.
In particular, please note that the posting of extracts from TSI commentaries
at other web sites or providing links to TSI commentaries at other web
sites (for example, at discussion boards) without our written permission
is prohibited.
We reserve the right to immediately
terminate the subscription of any TSI subscriber who distributes the TSI
commentaries without our written permission.
The War
Cycle
Studies of long-term cycles have shown
that the amplitude and frequency of military conflicts tend to increase
after commodity prices have reached a major bottom and turned higher. And
this link between commodity price cycles and military conflict led Richard
Kelly Hoskins to refer to the secular upward trends in commodity prices
as "war cycles" and the secular downward trends as "peace cycles".
When we first discussed Hoskins' work
in May of last year (http://www.speculative-investor.com/new/article050503.html)
we said that the Peace Cycle that began in 1980 had probably ended at the
1999 commodity-price low, which would have meant that we were 4 years into
a War Cycle that was likely to last more than 20 years (no War Cycle of
the past 250 years has lasted less than 22 years). And the happenings since
then -- in particular, the spectacular upward move in commodity prices
and the expansion of the so-called "war on terror" -- have helped solidify
this view. Actually, we no longer think there is much doubt that 1999-2001
was a transition period from a Peace Cycle to a War Cycle.
War cycles are typically characterised
by concerted government efforts to borrow lots of new money into existence.
In fact, the link between rising commodity prices and the escalating frequency/magnitude
of war probably exists because war provides an excuse for government-sponsored
inflation on a grand scale and commodities are beneficiaries of the inflation.
However, we expect that gold will be the main beneficiary of the current
inflationary War Cycle because as well as being a commodity it is now the
only sound money in the world (it is money that cannot be inflated into
oblivion by governments).
The investments that would be likely
to fare the worst throughout the War Cycle are those investments that do
well in times when the monetary system is perceived to be stable and confidence
in government is rising. Bonds obviously fall into this category, so although
bonds have done well during the first few years of the current war cycle
they are likely to be very poor performers over the coming 5-10 years.
Airline companies also fall into this category, but unlike bonds they have
performed exactly as they would be expected to perform during a period
when energy prices and the perceived risk of traveling were both on the
rise (see chart below).
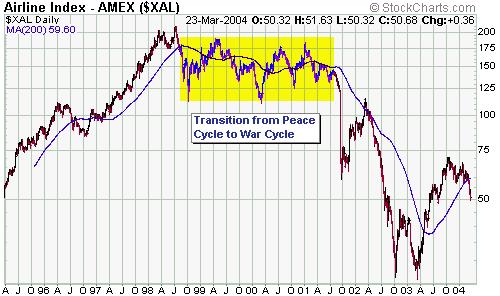
As far as traders are concerned, it
really makes no difference whether we are in a War Cycle or a Peace Cycle
because at any time anything could be suitable to buy for a trade. For
example, the AMEX Airline Index gained 150% between March and October of
last year, so the airline sector was one of the best places to be 'invested'
during that brief period. However, in order to profit from the ferocious
bear market rallies that occur every now and then your timing must be extremely
good. On the other hand, if you invest in something that happens to be
in a long-term bull market then even if you buy at the worst possible time
(at an intermediate-term peak) you should still make money; provided, of
course, that you are prepared to hold for at least 2 years and do not allow
yourself to be shaken-out during the pullbacks. This is because you will
be bailed out by the long-term trend.
The US
Stock Market
Commodity-Cyclical Stocks
World exchange inventories of high-grade
copper presently total about 500,000 tons, down from 1.5M tons just two
years ago. Furthermore, Phelps Dodge, the world's largest publicly-traded
copper producer, has forecast a 500,000 ton supply deficit for 2004. So,
does that mean there will be almost no copper inventory in the world by
the end of this year and that the copper price is headed for the moon?
Probably not. Forecasts of huge supply
deficits for a commodity often occur near important price TOPS whereas
the supply/demand situation invariably looks extremely bearish near important
bottoms (recall that there were supply gluts as far as the eye could see
when the copper price turned higher during the final quarter of 2001).
Also, all the publicly available supply/demand information for the industrial
metals, including the aforementioned Phelps Dodge forecast, is factored
into the current market price.
The market might turn out to be wrong,
but at the moment the message from the market is that the demand for copper
and other base metals is either going to taper off over the next 9 months
or new sources of supply -- reversals of production cuts made during 2001-2002,
for instance -- are going to replenish inventories. We say this because
the price action in several of the metals indicates that a top might be
close at hand and because the stocks of the major industrial metals producers
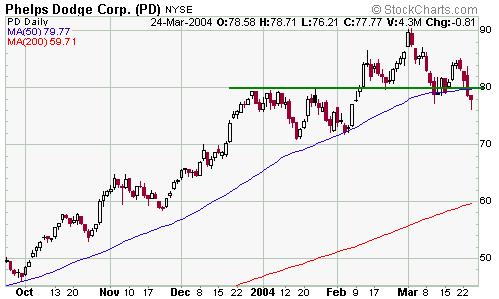
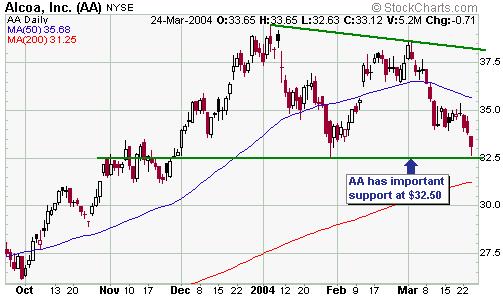
appear to be discounting a downturn. For example, the below charts of Phelps
Dodge (PD) and Alcoa (AA) are showing distinct signs of weakness.
Given the large upward moves they've
had over the past year both stocks are entitled to a 'pause for breath'
and at this stage the price declines fall within the bounds of routine
pullbacks. However, notice the potential head-and-shoulders top formation
in the PD chart and the fact that AA is poised just above important support
at 32.50. These charts reveal a potential for significant additional weakness.
Since the third quarter of last year,
when the money-supply growth trend in the US reversed lower, our expectation
has been that signs of economic weakness would appear by the second quarter
of this year. The downturns in economically-sensitive stocks such as PD
and AA are consistent with this expectation. We do, however, expect that
the industrial metals and the stocks of the companies that produce them
will move to considerably higher levels following some weakness over the
coming 1-2 quarters. In other words, we are anticipating substantial corrections
to on-going bull markets.
Current Market Situation
The US stock market has stabilised
over the past two trading days and is probably close to a low in terms
of time, but not in terms of price. We expect that a bottom will be in
place before the end of next week, but unless that bottom is well below
yesterday's closing levels we would not anticipate much of a rebound before
the short-term downtrend resumed. In other words, in order to create an
important low -- one from which a large advance could be launched -- in
synch with the March cycle discussed at TSI over the past few weeks, the
market will probably have to drop sharply within the next several days.
Specifically, a drop by the S&P500 to near its 200-day moving average
(around 1050) would, we think, be the absolute minimum needed to set the
stage for a strong market during April-May. A drop to 1020 or lower would
be better, though, because every man and his dog will be looking for the
market to bounce from near the 200-day moving average.
The market is oversold, but the sharpest
declines often begin AFTER an oversold condition has been reached. What
we would expect to see, near an important low, is an oversold extreme being
registered by indicators such as the McClellan Oscillator and the equity
put/call ratio combined with relative strength in the riskier stock sectors
(for example, strength in the NDX relative to the Dow and strength in the
Semiconductor Index relative to the NDX).
Our view continues to be that the S&P500
and Dow Industrials will move to new recovery highs following the current
correction, but this view is predicated on a washout decline occurring
over the coming week.
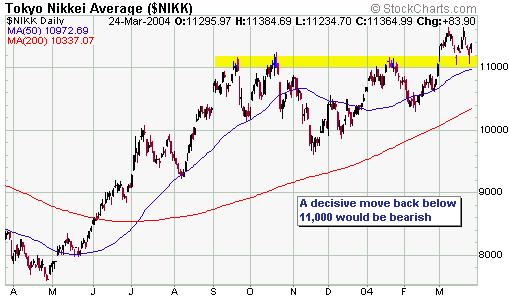
A market to watch closely at this time
is the Japanese stock market. The Nikkei225 Index (refer to the chart below)
broke out to the upside at the beginning of March and has held above its
former resistance (now support) in the 11,000-11,200 range during subsequent
pullbacks. We wouldn't read much into the Nikkei's relative strength at
this time because it is occurring during the final few weeks of Japan's
financial year (a time when market manipulation tends to occur on a rather
large scale). However, a drop below 11,000 would indicate that an important
top was in place for the Nikkei and would, therefore, be a very significant
bearish development.
Gold and
the Dollar
Current Market Situation
Over the past few weeks we've said
that gold needed to close above its February peak to confirm that a correction
low was in place, and the below daily chart of June gold futures shows
that this occurred on Tuesday.
After closing above resistance on Tuesday
the gold price immediately moved back below resistance on Wednesday, making
the breakout look like a 'head fake'. However, we don't think Wednesday's
downward reversal was significant because gold had moved higher for 7 trading
days in a row prior to this session so a pullback was a high probability
regardless of what the future held in store. The way we see it, Tuesday's
short-lived breakout confirms the early March low because we doubt that
a rebound within a continuing downward trend would have made it that far.
Therefore, following a pullback we expect that the gold price will move
to a new high for the year ($440 is a reasonable upside target over the
coming month).
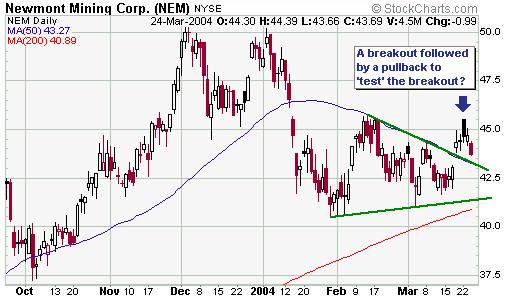
The missing piece of the puzzle as
far as the gold market is concerned -- there often is at least one missing
piece, by the way, because Ms Market likes to create as much confusion
as possible -- is the fact that Newmont Mining (NEM) has not yet managed
to close above its February peak. In other words, NEM has not yet confirmed
the above-mentioned sign of strength in the gold price. This is not a great
concern at this stage because NEM bottomed one month before gold and appears
to have broken out of a consolidation pattern last week (see chart below).
If this interpretation is correct then we are probably just seeing a routine
breakout pullback with a move above the February high to follow over the
coming weeks.
The biggest short-term risk to the
gold sector continues to be the potential for a sharp decline in the broad
stock market. The major gold stocks have weathered the recent stock market
weakness quite well, but that's mainly because there hasn't yet been any
widespread panic.
As discussed many times in the past
it makes a lot more sense to forecast the US$ based on the current performance
of the gold price than to forecast the gold price based on the current
performance of the US$. This is because the gold market tends to ANTICIPATE
the currency market more so than REACT to it. In other words, in most cases
when gold and the US$ move higher together the correct interpretation is
that the US$ advance will prove to be unsustainable.
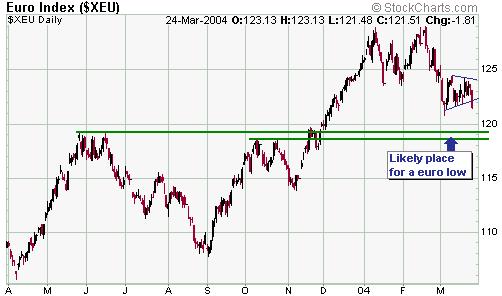
Further to the above, gold's recent
strength suggests that the Dollar's rebound has almost run its course.
Our expectation continues to be that the euro will bottom at around 1.19
(less than 2% below yesterday's close).
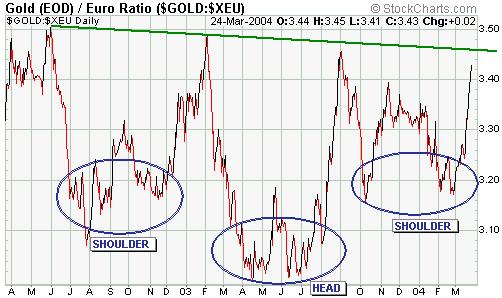
Gold in terms of the euro
Over the past two years the gold price
in terms of the euro has traced-out a potential head-and-shoulders bottom
formation (see chart below). An upside breakout from this pattern would
project a move to around 390 euros (US$475 at the current euro/US$ exchange
rate).
What to do
In previous commentaries we've stressed
the need to have a substantial cash reserve in the current high-risk environment.
We have little doubt that gold stocks in particular and commodity stocks
in general are going to move much higher over the next few years, but these
stocks will experience sharp corrections from time to time; and it will
only be possible to ride-out these corrections without losing sleep if
you have a sizeable cash cushion. Cash, by the way, includes gold bullion.
For those that are 'cashed up' and
looking to put some money to work in the stock market, we think the gold
sector offers by the far the best risk/reward right now. However, although
some of our favourite metal stocks have pulled back to levels where risk
appears to be relatively low -- NovaGold and Taseko spring to mind -- we'd
be inclined to wait to see what happens in the stock market over the next
1-2 weeks before doing any buying. Holding off on doing any more buying
until NEM closes above $46 would also be a reasonable tactic.
Update
on Stock Selections
 Although
we discussed Cumberland Resources (CLG) in last week's Interim Update we
are going to review it again today; not just because its stock price took
another hit earlier this week but also because the problem facing Cumberland
(rising costs) is going to be faced by all mining companies. Although
we discussed Cumberland Resources (CLG) in last week's Interim Update we
are going to review it again today; not just because its stock price took
another hit earlier this week but also because the problem facing Cumberland
(rising costs) is going to be faced by all mining companies.
Prior to the start of trading on Monday
CLG announced that "...the current pre-production capital cost estimate
for the [Meadowbank] project (including 12% contingency and 15% engineering,
procurement and construction management on direct costs) exceeds $CDN 350
million for the 5500 tonne per day production model, due to increases in
almost all items required for construction. Associated net asset values
and rates of return have not yet been calculated because of the incomplete
state of the study."
In making this latest announcement
on the heels of last Wednesday's disappointing news CLG violated one of
the unwritten rules of stock price management. The rule is that wherever
possible all the bad news should be 'got out of the way' at the one time
to prevent the stock from taking more than one big hit. Management no doubt
thought they were doing the right thing by releasing information as soon
as it became available, but since the two announcements were only separated
by three business days we don't see why the news couldn't have been released
at the one time. Doing so would have resulted in one big emotional reaction
rather than two.
As far as the news itself is concerned,
there are obviously still a lot of gaps that need to be filled in. What
we now know is that the capital costs that have just been estimated are
almost double the old estimates, making it necessary for the company to
review alternatives to the current 5,500tpd production model. What we don't
know is whether there will be a significant increase in the estimated operating
costs (it had previously been thought that Meadowbank would produce 250K
ounces/year at a cash cost of US$168/ounce). All we can do, therefore,
is make some assumptions and work from there.
Readers who have been with us for a
while might recall the gold stock valuation comparisons we did last June
and August in which we calculated what we termed the "Theoretical Enterprise
Value (TEV)" for about 15 junior gold companies at various gold prices
with the aim of figuring out which stocks offered the best value and provided
the most leverage. We went back to the spreadsheet prepared at that time
and recalculated the TEV for Cumberland at different gold prices assuming
that a) the capital cost would be C$350M, b) there would be no change to
previously-estimated cash operating costs, and c) 2M ounces of the current
4M ounce resource would be converted to mineable reserves. When we did
this we arrived at a theoretical value per CLG share of C$3.20 at a gold
price of US$425 and C$6.90 at a gold price of US$500. However, we also
found that by changing our assumptions the theoretical value of the stock
could change quite dramatically. For example, if CLG could develop its
resource to the point where 3M ounces were in the mineable reserve category
while the other assumptions remained the same then the theoretical value
at a gold price of US$425 would rise from C$3.20 to C$8.00/share. On the
other hand, assuming a capital cost of C$350M, a mineable reserve of 2M
ounces and a 15% increase in total production costs per ounce gives a theoretical
value of C$1.60/share at a gold price of $425 and C$5.30 at a gold price
of $500.
After looking at various 'what if'
scenarios we arrived at the conclusion that Meadowbank would not be a viable
project if the gold price was going to remain at or below its current level
AND the C$350M capital cost estimate was about right AND production costs
were re-estimated to be more than 10% higher than the previous estimate.
However, even assuming these higher costs the project would likely be very
profitable if the company could prove-up a 3M ounce reserve (as opposed
to the 2M ounce reserve that most calculations are currently being based
on) or the gold price made a sustainable move above US$475/ounce.
The bottom line is that CLG now has
greater risk and greater upside potential than would have been the case
if the Feasibility Study had been in line with the market's expectations;
greater risk because the company is now more heavily reliant on either
additional exploration success or a higher gold price and greater upside
potential because the combination of a higher cost structure and a lower
share price makes it a far more leveraged play on the gold price.
Other things worth noting are that
CLG is in very good financial shape (it has no debt and about C$45M in
cash) and that the Feasibility Study has probably been done at the worst
possible time (it's quite possible that the prices for many of the construction
inputs are currently close to peak levels).
We are going to retain CLG in the Stocks
List (and, by the way, in our own account) because we think a gold price
in the $475-$500 range is very achievable this year and because past performance
suggests that the company will achieve further exploration success at Meadowbank.
The wider issue is that other development-stage
mining companies are no doubt going to find that the costs to build a mine
are now considerably higher than they were just 12 months ago. By the same
token existing mines are now worth more than they were, so companies with
existing production might deserve to trade at a greater premium.
But even the gold producers will be
affected. All else being equal, companies with existing gold production
are going to find that their operating costs this year will be significantly
above what they were last year. This is, in fact, the other side of the
inflation coin as far as mining companies are concerned (the companies
initially benefit from the effects of inflation on the prices of their
products but later find that their margins are being squeezed due to the
effects of inflation on their costs).
In the coming Weekly Update we'll look
at whether there are other mining stocks in the TSI List with the potential
to report big negative surprises due to higher costs.
The
stock of Argentine agricultural company Cresud (NASDAQ: CRESY) gained 20%
on Wednesday on heavy volume, for no reason that we are aware of. Perhaps
it was recommended by another newsletter. In any case, it has now broken
decisively to the upside.
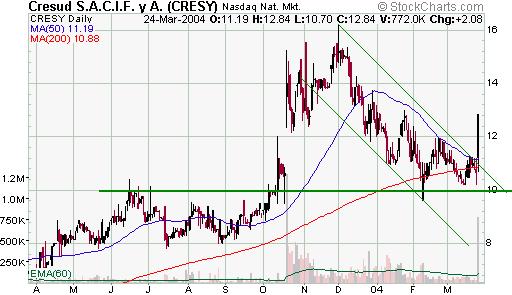
Our most recent mention of CRESY was
in the 15th March Weekly Update, when we said that it was a low-risk buy
(the stock price was $10.26 at the time). We wouldn't be buying the stock
now that it has made such a sharp move, but nor would we be selling. CRESY
is one of the few ways for stock market participants to 'play' the rally
in soybeans, corn, wheat, etc., and might now be starting to draw some
attention.
Chart Sources
Charts appearing in today's commentary
are courtesy of:
http://stockcharts.com/index.html
http://www.futuresource.com/

|
