![]()
![]()
![]()
![]()
- Interim Update 24th May 2017
Copyright
Reminder
The commentaries that appear at TSI
may not be distributed, in full or in part, without our written permission.
In particular, please note that the posting of extracts from TSI commentaries
at other web sites or providing links to TSI commentaries at other web
sites (for example, at discussion boards) without our written permission
is prohibited.
We reserve the right to immediately
terminate the subscription of any TSI subscriber who distributes the TSI
commentaries without our written permission.
Just how weak is the US
economic expansion?
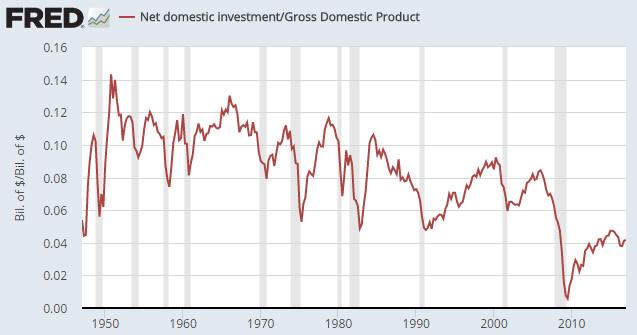
TThe following chart
encapsulates what's wrong with the US economy and why it will continue to
deteriorate on a long-term basis unless Keynesian monetary and fiscal
policies are abandoned.
The chart shows that US Net Domestic
Investment* oscillated between 6% and 12% of nominal GDP until the
late-1970s, with moves outside this range being short-lived. From the
late-1970s to the present, however, it has been in a downward trend and at
no time since the final quarter of 2007 has it been above 6%. Furthermore,
from the early-1950s through to 2007 it never fell below 4.8%, even at the
depths of the worst recessions. And yet eight years into the current
economic expansion the level is only 4.2%.
According to the "Austrian" school of economics, the downward trend in
Net Domestic Investment relative to GDP can be explained by the
combination of a) Federal Reserve manipulation of interest rates and money
supply that caused the economy to careen from boom to bust and caused vast
amounts of capital to be consumed via the countless ill-conceived
investments that were incentivised by the manipulation, b) increased
government spending (the more the government diverts resources to its own
uses, the less opportunities there will be for the private sector to
invest in new business ventures and technologies), and c) regime
uncertainty (the more unpredictable the actions of an interventionist
government the more reticent the private sector will be about making
long-term investments).
The "Austrians" are right.
Of the
aforementioned contributors to the decline in the amount of investment in
future growth, the first (the machinations of the Fed) has been by the far
the most important until now. That's why the downward trend accelerated in
2007. It was in 2007 that the real-estate-related investment boom fueled
by the Fed began to unravel in earnest, leading to a financial crisis and
recession that prompted a new round of monetary manipulation that was
unprecedented in its aggression and relentlessness. In effect, the doctor
prevented a proper recovery by numbing the patient with a large and
never-ending flow of morphine.
Unfortunately, with a central bank
chief who believes that monetary stimulus has helped support the economy
and a
president who believes that the government should "prime the pump",
there is no chance of the policies that brought about the economic decline
being abandoned anytime soon.
*Net Domestic
Investment is total investment minus the investment needed to maintain the
existing capital stock. It is the investment that leads to growth in
productivity and, therefore, to real economic progress.
The Stock Market
The US
Although the S&P500 Index (SPX) ended the 24th May session at an all-time
closing high, it hasn't yet decisively broken above its 1st March high.
For all intents and purposes it has now spent almost three months trading
sideways.
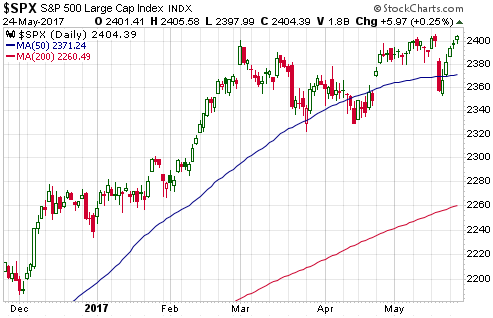
With the benefit of hindsight we know that the 17th May plunge was not
the warning shot it initially appeared to be. It didn't change or signal
anything of significance. The market (the SPX) now has an opportunity to
effect an upside breakout, but note that it has just risen for five days
in a row and is acutely vulnerable to a negative catalyst.
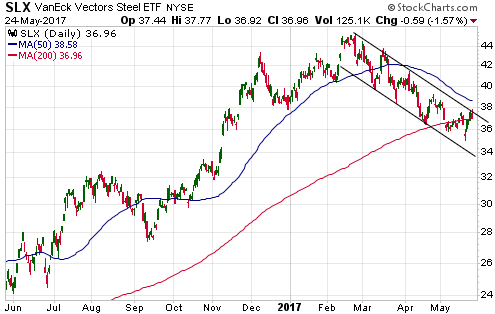
The
steel sector of the US stock market is worth featuring today because it is
in a position where a modicum of additional strength would signal the end
of a multi-month decline. We are referring to the fact that the VanEck
Vectors Steel ETF (SLX) ended Wednesday's session at the top of a
well-defined downward-sloping channel that began to form three months ago.
A daily close above $38.60 would break SLX above its channel top and
its 50-day MA. This would be more of a problem for our bearish outlook
than a new high in the SPX, because SLX is economically-sensitive and is
not being supported by the handful of large-cap market darlings
("TFAANNG": Tesla, Facebook, Amazon, Apple, Netflix, Nvidia and Google)
that has kept the SPX near its all-time high.
Gold and the Dollar
Gold
Over the past 5 days the US$ gold price has moved in a narrow range
slightly below lateral resistance in the low-$1260s and slightly above its
50-day and 200-day MAs. This price action leaves the door open to a
near-term test of the April high.
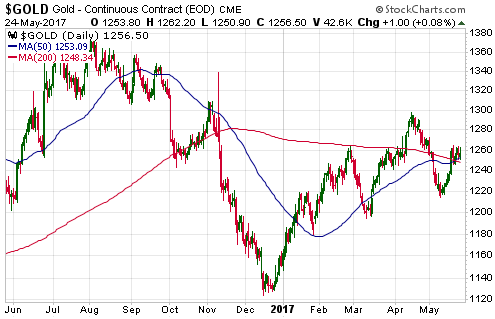
In euro terms, however, the gold price is well below its 50-day and
200-day MAs and is desperately trying to hold lateral support defined by
its March low (the equivalent of US$1195).
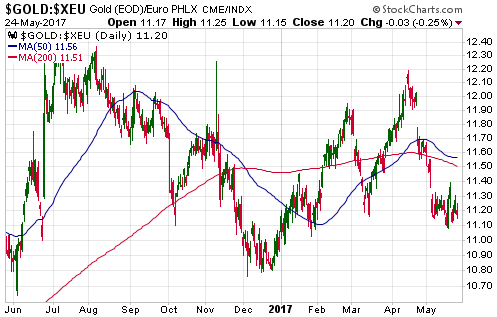
The difference between gold's recent performance US$ terms and gold's
recent performance in euro terms is bearish. It doesn't preclude a rise in
the US$ gold price to the vicinity of its April high within the coming
week or so, but it is consistent with the view that near-term strength
would prove to be fleeting and would be followed by a decline to new
multi-month lows.
Gold Stocks
Current Market Situation
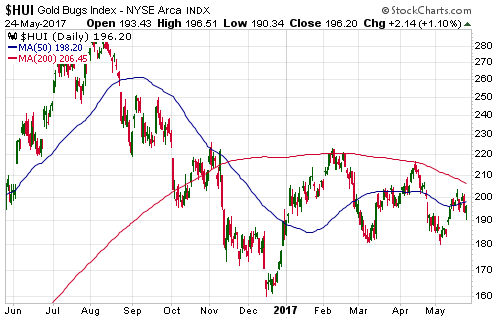
The HUI
may have made a rebound peak last week, but with gold retaining the
potential to test its April high there is still a realistic chance of the
HUI moving up to 205-210 before commencing a decline that should take it
to a new low for the year and will possibly take it to a new 12-month low.
One of the main reasons to expect the HUI to make a new low for the
year within the coming two months is the performance of the HUI/gold
ratio. As illustrated below, this ratio has been making lower highs and
lower lows since February. This sort of performance by the HUI/gold ratio
is usually followed by significant short-term weakness in both gold and
the HUI.
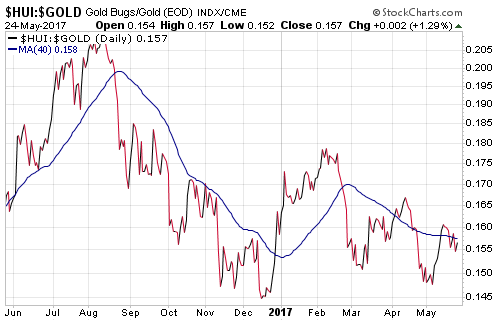
Gold stocks for a multi-month trade
The stage is being set for an important low (probably the low for the
year) and an excellent buying opportunity in the gold-mining sector during
June-July. Our guess at this time is that the low for the gold-stock
indices will occur in July, but it's reasonable to expect that individual
gold-mining stocks will bottom at different times and that some will
bottom by mid-June. In particular, some of the junior gold-mining stocks
that are adversely affected by the next quarterly rebalancing of GDXJ will
probably bottom by/on 16th June.
We intend to add two or more
gold-stock trading positions to the TSI list within the next two months in
anticipation of a rally lasting at least three months. The stocks we add
will ideally have all of the following attributes:
1) 'Oversold' on
a short-term basis
2) Under-valued in both absolute and relative
terms
3) Solid balance sheet
4) Low risk of a dilutive
equity financing
5) Likely to significantly outperform the
gold-mining ETFs during the next sector-wide rally
6) Likely to be
adversely affected by the mid-June GDXJ rebalance
To date we have
short-listed five gold-mining stocks for potential trades, two of which
are current members of the TSI List. In alphabetical order, here they are:
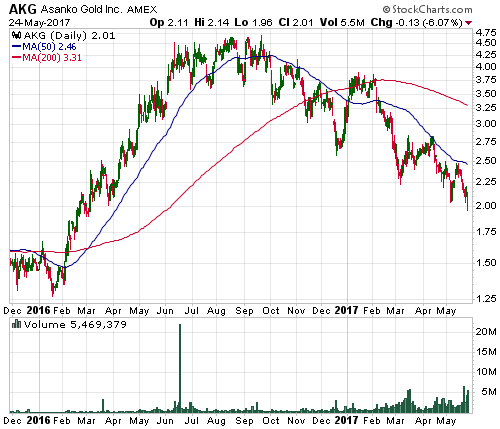
1) Asanko Gold (AKG)
AKG is producing gold at
the rate of about 235K-oz/year at Stage 1 of the Asanko Gold Mine (AGM) in
Ghana and has a plan to increase its production to about 450K-oz/year by
2020 (the Stage 2 Expansion).
There is a potential issue with the
resource estimate for Stage 1 of the AGM (the Nkran deposit), in that the
deposit possibly contains a lot less recoverable gold than assumed in the
mine plan. This risk is now widely known, which is why AKG has been much
weaker than GDXJ over the past six months.
The risk has been
mitigated by the stock's relative weakness and the fact that the mining
emphasis will shift over the next few years due to the Stage 2 Expansion.
Furthermore, it shouldn't prevent the stock from rebounding strongly from
whatever low is made over the next several weeks.
Our tentative
plan is to add a trading position in AKG in anticipation of a rebound to
at least US$3.00, although we haven't yet decided on a buy level. We would
probably be interested at US$1.75, but a lot will depend on the
Feasibility Study (FS) for Stage 2. The FS results are due on 5th June.
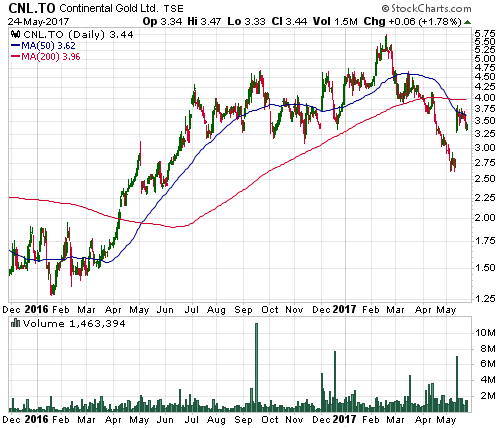
2) Continental Gold (CNL.TO)
CNL is developing
the high-grade Buritica gold project in Colombia. The project is just
entering the construction phase, with the company having received all
necessary permits and arranged all necessary financing.
We perceive
an uncomfortably-high risk that the Buritica project's resource model is
not accurate and therefore that the economics will not be anywhere near as
good as those estimated in the Feasibility Study (FS), but if that risk is
going to materialise it won't be until the project goes into production in
2020. It shouldn't be an issue over the next 6 months.
Assuming
that the FS economics are roughly correct, CNL offers good value near its
current price of C$3.44. However, to improve our risk/reward we are hoping
for the opportunity to take a position near where the stock was trading in
early-May -- just before it cleared the final financing hurdle. Such a
buying opportunity could arise due to the combination of sector-wide
weakness and the reduction in CNL's weighting within GDXJ.
Our plan
is to add a CNL.TO trading position to the TSI List at C$2.85 in
anticipation of a rebound to C$4.50-C$5.00.
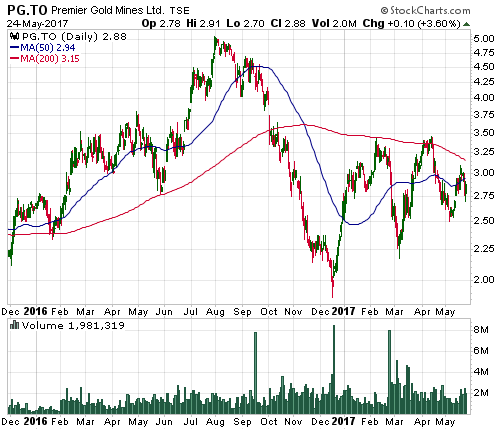
3) Premier Gold (PG.TO)
PG is an existing TSI
stock and therefore needs no introduction. It has a strong balance sheet,
about 130K-oz/year of current production, ample leverage and an attractive
valuation. It will also be vulnerable to the effects of GDXJ selling prior
to mid-June.
Our plan is to add a PG.TO trading position to the TSI
List at C$2.30 in anticipation of a rally to around C$4.00.
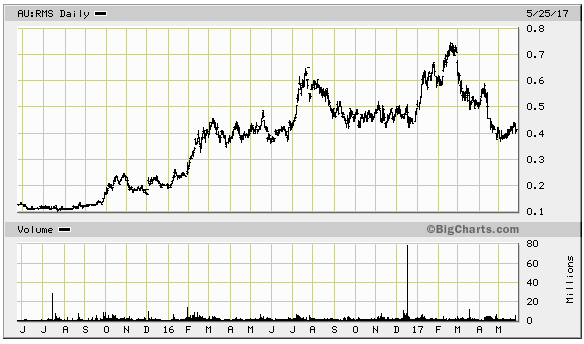
4) Ramelius Resources (RMS.AX)
Like PG, RMS is
an existing TSI stock and therefore needs no introduction. Also like PG,
it has a strong balance sheet, about 130K-oz/year of current production,
ample leverage, an attractive valuation and a vulnerability to the effects
of GDXJ selling prior to mid-June.
Our plan is to add an RMS.AX
trading position to the TSI List at A$0.33 in anticipation of a rebound to
the A$0.50s.
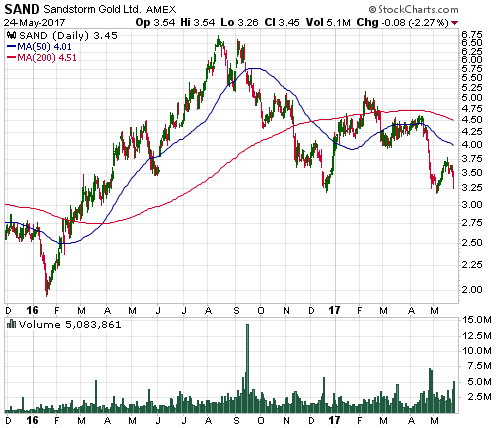
5) Sandstorm Gold (SAND)
SAND is a mid-tier
royalty/streaming company. Unlike the stocks of the large
royalty/streaming companies (Franco Nevada and Royal Gold), SAND shares
offer good value. However, to get the sort of leverage to a general
gold-sector rebound that we are looking for our purchase price will have
to be significantly below the current level. Anything in the US$2.50-$2.75
range would probably work well.
At this stage our plan is to add a
SAND trading position to the TSI List at US$2.60 in anticipation of a
rebound to US$4.00-$4.50, but it might turn out that we are being too
stingy and will have to raise our buy price. We will see how it goes, but
anything under US$3 would be reasonable.
The Currency Market
A routine counter-trend
rebound in the Canadian dollar (C$) would have stopped at around 74, but
with Wednesday's strength the C$ has moved a little beyond this target.
This could be nothing more than an extension to the pattern of the past 12
months -- a pattern that involves breaks to new lows being quickly
followed by upward reversals and recoveries to either the 200-day MA or
the top quartile of the channel drawn on the daily chart displayed below.
If so, the C$ has no more than 1 point of additional short-term upside
potential.
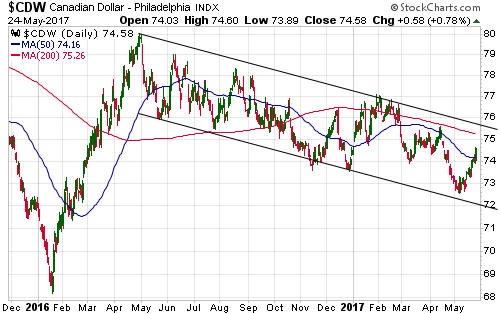
Our guess is that the C$'s intermediate-term downward trend will
resume within the next several days and won't end until July-August.
However and as mentioned in the latest Weekly Update, the C$'s
extraordinarily bullish COT situation opens up the possibility that the
early-May low will turn out to be the low for the year.
Updates on Stock Selections
Notes: 1) To review the complete list of current TSI stock selections, logon at
http://www.speculative-investor.com/new/market_logon.asp
and then click on "Stock Selections" in the menu. When at the Stock
Selections page, click on a stock's symbol to bring-up an archive of
our comments on the stock in question. 2) The Small Stock Watch List is
located at http://www.speculative-investor.com/new/smallstockwatch.html
![]() New
TSI Stock Selection: Cordoba Minerals (TSXV: CDB). Shares: 89M issued, 96M
fully diluted. Recent price: C$0.77
New
TSI Stock Selection: Cordoba Minerals (TSXV: CDB). Shares: 89M issued, 96M
fully diluted. Recent price: C$0.77
We hadn't planned to
add more exposure to copper to the TSI List until the third quarter of
this year, because there's a good chance of further weakness in the price
of copper and the prices of copper-mining equities over the coming three
months. However, the recent sharp decline in CDB's stock price has
established the sort of intermediate-term risk/reward that shouldn't be
ignored. We perceive additional downside risk of around 20% versus upside
potential of at least 100%.
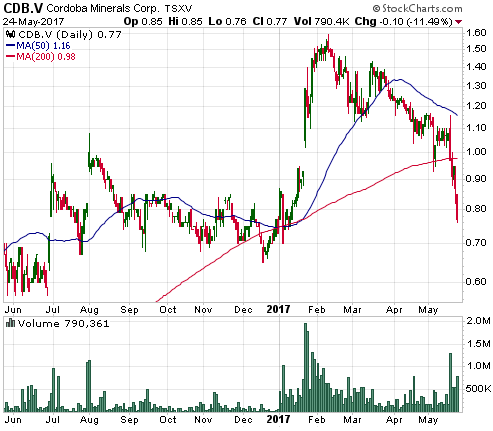
CDB is effectively Robert Friedland's publicly-traded vehicle for
minerals exploration/development in Latin America. Friedland's private
company High Power Exploration (HPX) is earning 65% of CDB's
district-scale San Matias copper-gold project in Colombia by paying all
costs to advance the project to the point where it has a completed
Feasibility Study (FS). Also, HPX owns about 37% of CDB.
The FS
that HPX is currently funding will focus on the Alacran copper-gold
deposit, a medium-grade copper-gold porphyry. According to the initial
Inferred resource reported in early-January, the deposit contains 827M
pounds of copper at an average grade of 0.70% and 644K ounces of gold at
an average grade of 0.37-g/t.
Based on the above-mentioned resource
and the fact that it will end up with only a 35% stake, CDB is far from
cheap at its current market cap of C$68M. The reasonable expectation,
however, is that the resource will get much bigger with additional
exploration. Friedland certainly wouldn't be interested unless there was
multi-billion-pound potential.
As well as the strong potential to
host a large, economically-viable medium-grade copper deposit, there are
signs that the project hosts a significant quantity of high-grade gold. In
fact, the stock's extreme volatility over the past 5 months was mostly
about this high-grade gold opportunity, with a single spectacular gold
intercept of 0.9m averaging 4,440-g/t in January propelling the stock from
the C$0.90s to the C$1.50s and subsequent drilling results that failed to
duplicate the success leading to the recent collapse.
We like the
chances of additional spectacular gold intercepts being reported, but our
CDB speculation doesn't depend on them. It depends on the ability of the
CDB-HPX joint venture to define a large, medium-grade copper-gold porphyry
with good economics.
In addition to recent drilling results that
didn't meet the high expectations of some shareholders, the stock has
probably been under pressure due to the likelihood of an equity financing
in the near future. The company only has about C$1M of working capital and
will therefore need to raise more money soon, but it won't need to raise a
lot of money because HPX will be paying all project exploration and
engineering expenses for the foreseeable future.
Our suggestion is
to take an initial position in CDB near its current price of C$0.77 and be
prepared to average-in over the next few months.
Chart Sources
Charts appearing in today's commentary
are courtesy of:
http://stockcharts.com/index.html
http://bigcharts.marketwatch.com/
http://research.stlouisfed.org/
![]()