![]()
![]()
![]()
![]()
- Interim Update 24th June 2020
Copyright
Reminder
The commentaries that appear at TSI
may not be distributed, in full or in part, without our written permission.
In particular, please note that the posting of extracts from TSI commentaries
at other web sites or providing links to TSI commentaries at other web
sites (for example, at discussion boards) without our written permission
is prohibited.
We reserve the right to immediately
terminate the subscription of any TSI subscriber who distributes the TSI
commentaries without our written permission.
The Stock Market
In the latest Weekly Update we
concluded the US stock market discussion as follows:
"Due to
the bearish fundamentals, the news-related risks and the extent to which
prices became stretched to the upside a couple of weeks ago, this is a
time to be very cautious. However, due to the on-going deluge of money and
the mixed sentiment situation, it is not a time to be aggressively
bearish.
We continue to anticipate a short-term correction that
(for the SPX) probably will be limited to a 50% retracement of the rally
from the March low."
Although there was a significant price
decline on Wednesday 24th June, the overall picture is unchanged. We are
anticipating a short-term decline in the SPX to 2700-2800, but to signal
that something more than a minor multi-week consolidation is underway the
SPX will have to break below 3000. It ended Wednesday's session at 3050,
which happens to be slightly above the psychologically-important 200-day
MA.
The Russell2000 ETF (IWM), which is the focus of our current bearish
speculations (the TSI Stocks List contains an IWM October-2020 put option
and our own account contains IWM put options with August-2020 and
October-2020 expiry dates), is in a weaker position than the SPX. It broke
below its 200-day MA and important lateral support during the week before
last, tested its downside breakout last week and resumed its short-term
downward trend on Wednesday 24th June. We are anticipating a decline to
$125 or lower.
Gold and the Dollar
Gold
During the first half of this week the US$ gold price briefly traded at a
new multi-year high and then pulled back. This has created the appearance
of a successful test of the April-2020 high.
In euro terms the gold price is yet to test its April-2020 high, but
on Tuesday of this week it broke above its 50-day MA. This is a positive
development.
According to the mainstream press, strength in the US$ was to blame
for gold's price reversal on Wednesday. The problem with that reasoning is
that over the past year the US$ gold price has been positively correlated
with the Dollar Index more than half the time. This is illustrated by the
following chart.
The US dollar's exchange rate is just one of
several drivers of the gold price. Weakness in the DX generally will be
associated with strength in the US$ gold price if all things remain equal,
but all things rarely remain equal.
Rather than being due to any particular fundamental development,
inter-market relationship or news, it's most likely that Wednesday's
reversal in the US$ gold price was driven by technically-oriented selling
by speculators after important resistance (the April high) was reached.
We think that gold will break above its April-2020 high within the
next few weeks, perhaps following some consolidation in the $1750-$1780
range. However, at this time we aren't anticipating a major rally to
all-time highs (the all-time high was around US$1925 in 2011). Our guess
is that gold's next short-term peak will be in the $1815-$1850 range,
although much will depend on the progress (or lack thereof) with regard to
reopening economies and developing effective COVID-19 treatments. The
slower the progress, the greater the demand for the safety offered by
gold.
Silver
At this stage, silver's
correction from its early-June peak looks similar to the correction that
unfolded during April-May. To maintain the similarity, the silver price
(basis the July-2020 futures contract) will have to hold above $17.00
during additional corrective activity over the days ahead.
We think
that silver has short-term upside potential of $2-$3 and short-term
downside risk of $2-$3, resulting in a neutral risk/reward. However, on an
intermediate-term basis the potential reward is much greater than the
risk.
Gold Stocks
Over the first three days of this
week the HUI broke above its 50-day MA, tested long-term resistance at 286
(the 2016 high) and then pulled back to its 50-day MA. This price action
is constructive and is more evidence that the gold sector's correction is
complete.
That being said, there is significant short-term risk in
the gold mining sector due to the mounting evidence that the broad stock
market is in the early part of a correction that could take the SPX down
by as much as 10%. It's hard to imagine that the HUI and the gold mining
ETFs would remain above their recent lows if the SPX were to suffer a
quick decline to 2700-2800.
Ideally (from a short-term bullish perspective) the HUI will remain
above its 50-day MA on a daily closing basis during pullbacks over the
days ahead, but last Thursday's low (256) should be viewed as critical
support. Breaching this support probably would be followed by a quick
decline to the vicinity of its 200-day MA (around 230), which, assuming no
major change in the fundamentals, would offer both short-term and
long-term traders an excellent opportunity for new buying.
The Currency Market
Revisiting the global US$ short position
Financial market
discussions and analyses often focus on fundamental issues that don't
matter, or at least don't provide useful clues regarding the likely future
performance of the market in question. A good example is the so-called
"global US$ short position", which is regularly cited in support of a
bullish outlook for the US$.
The argument is that the roughly $12
trillion of US$-denominated debt outside the US constitutes a short
position that will create massive demand for dollars and thus put
irresistible upward pressure on the Dollar Index (DX). There is an element
of truth to the argument, but the "global US$ short position" always
exists. It exists during US$ bull markets and it exists during US$ bear
markets. Furthermore, the shaded area on the following chart shows that it
steadily increases over time and that even the 2008-2009 Global Financial
Crisis resulted in only a minor interruption to the long-term trend.
Consequently, it isn't a major intermediate-term or long-term driver of
the US dollar's exchange rate.
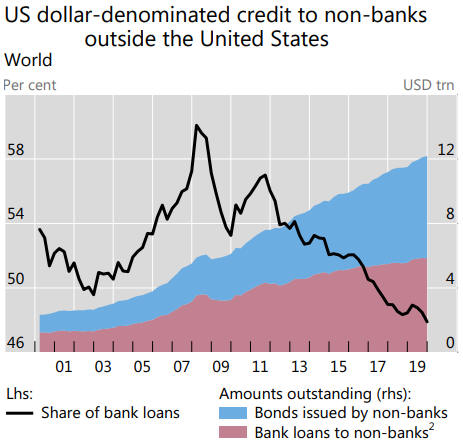
Source:
https://www.bis.org/statistics/gli2004.pdf
The element of truth
to the "global US$ short position" argument is that a significant
strengthening of the US currency relative to the currencies of other
countries will increase the cost of servicing dollar-denominated debt in
those countries. This lessens the ability to borrow additional US dollars
and puts pressure on existing borrowers to reduce their US$ obligations.
In effect, it leads to some short covering that magnifies the upward trend
in the US dollar's exchange rate. This means that while the "global US$
short position" won't cause the US$ to start strengthening, it can
exacerbate a strengthening trend.
We mentioned above that there is
no empirical evidence that the "global US$ short position" drives major
trends in the US dollar's exchange rate, but that doesn't guarantee that
the pile of US$-denominated debt outside the US won't become an important
exchange-rate driver in the future. The reason that it won't become
important in the future is that prices are driven by CHANGES in supply and
demand. The US$12T+ of foreign dollar-denominated debt represents part of
the existing demand for dollars, meaning that the demand-related effects
of this debt on the dollar's exchange rate are 'in' the market already. At
the same time, the total supply of dollars is growing rapidly.
At
this point it's worth addressing the idea that the Fed would be powerless
to stop the US$ from appreciating if a major 'debt deflation' got
underway. This is nonsense. Until the law of supply and demand is
repealed, someone with the unlimited ability to increase the supply of
something WILL have the power to reduce the price of that thing.
The Fed's power to reduce the relative value of the US dollar was
demonstrated in spades over the past few months. The major
financial-market panic and economic collapse of March-2020 predictably
resulted in a desperate scramble for US dollars, leading to a fast rise in
the DX. However, it took the Fed only two weeks to overwhelm the surging
demand for dollars with a deluge of new dollar supply.
The upshot
is that the so-called global US$ short position is not a valid reason to
be a US$ bull.
The fundamentals that
matter
The "global US$ short position" always exists and
inevitably increases over time, so its existence doesn't determine the US
dollar's performance relative to other currencies. What, then, does
influence the performance of the Dollar Index (DX) over intermediate-term
timeframes?
As discussed in many previous TSI commentaries, it
seems that the most important fundamental drivers of the US$/euro exchange
rate, and therefore the most important fundamental drivers of the DX
(since US$/euro is about 60% of the DX), are US equities relative to
European equities and the US-Europe interest rate differential. We use the
SPY/EZU ratio to measure the former and the 10yr T-Note yield minus the
10yr Bund yield (UST10Y-DET10Y) to measure the latter.
The
following chart compares the DX with the above-mentioned drivers over the
past eight years.
We consider the fundamental backdrop to be
bullish for the DX when both fundamental influences (the SPY/EZU ratio and
the US-Germany yield differential) are in upward trends, neutral when the
fundamental influences are trending in opposite directions and bearish for
the DX when both fundamental influences are in downward trends. On the
following chart, the US dollar's fundamentals are deemed to be neutral
during Periods A and E, bullish during Periods B and D, and bearish during
Period C.
Note that even though the fundamental backdrop has been neutral for
the DX since late-2018, the DX has had an upward bias during this period.
This suggests that relative equity strength is more important than the
interest rate differential. That being said, the DX is less than one point
higher today than it was in late-2018, so the upward bias did not lead to
a meaningful net gain.
Also note the pronounced downward reversal
in the relative equity strength indicator over the past three months. This
is part of why we think that the DX made a multi-year top in March-2020.
Current Market Situation
The DX made a multi-week bottom about two weeks ago and has since been in
correction (countertrend rebound) mode. We are intermediate-term bearish
on the DX, but we expected this rebound.
The DX's short-term
risk/reward is neutral, with upside potential to around 98.5 and downside
potential to around 94.5 (the March-2020 low). It's likely that the
March-2020 low will be breached before year-end, but not until the final
quarter. In the meantime we are looking for a choppy market, with
multi-week periods dominated by risk-off sentiment giving the DX a boost
and multi-week periods dominated by risk-on sentiment pushing the DX
downward.
Updates on Stock Selections
Notes: 1) To review the complete list of current TSI stock selections, logon at
http://www.speculative-investor.com/new/market_logon.asp
and then click on "Stock Selections" in the menu. When at the Stock
Selections page, click on a stock's symbol to bring-up an archive of
our comments on the stock in question. 2) The Small Stock Watch List is
located at http://www.speculative-investor.com/new/smallstockwatch.html
![]() Mosaic
(MOS) stopped out
Mosaic
(MOS) stopped out
MOS closed below its trailing stop loss
on Wednesday 24th June and has been removed from the Stocks List. The
result was a loss of 37%.
This is another stock that we expect to
return to the List in the future. It could return as a long-term position,
because it's a good fit with one of our long-term investing themes (owning
fertiliser stocks as a way of profiting from rising prices for
agricultural commodities during 2020-2022).
 Changes to the
TSI Small Stocks Watch List (SSWL)
Changes to the
TSI Small Stocks Watch List (SSWL)
The SSWL is a list of stocks that are too risky and/or illiquid to be
considered for the TSI Stocks List. We don't track these stocks closely in
the TSI commentaries, but they have favourable risk/reward ratios (in
general: high risk versus much higher potential reward) and could be of
interest to speculators who are able to do their own due diligence. Today
we are deleting two stocks from the SSWL.
The first deletion is
Artemis Resources (ARV.AX), an exploration-stage gold, copper and cobalt
miner. This company has several "irons in the fire", but the only one of
real interest to us was its 50/50 JV with Novo Resources (NVO.V) at the
Purdy's Reward conglomerate gold prospect near Karratha in the northern
part of Western Australia.
ARV's stock price has 'perked up'
recently, but the company has exited its JV with NVO so the main reason
for our interest in the stock no longer exists. Therefore, it has been
removed from the SSWL.
The second deletion is Cassini Resources
(CZI.AX). CZI owns 30% of the West Musgrave Project (WMP), a large,
low-grade base metals (nickel and copper) project in Western Australia, as
well as some much smaller and earlier-stage exploration projects. Oz
Minerals (OZL.AX) owns the other 70% of the WMP.
We originally
brought CZI to the attention of our readers in October-2016, when it was
trading at A$0.05. We thought that the stock market was substantially
under-valuing CZI's 30% stake in the WMP and that OZL eventually would
make a takeover bid in order to consolidate its ownership of the project.
It was a long time in coming, but a deal has been done for OZL to purchase
CZI.
Under the deal, each CZI share will be exchanged for OZL
shares with a current market value of about A$0.15, A$0.01 of cash and a
share of a new company called Caspin Resources. Caspin will own CZI's
non-WMP exploration-stage assets -- 80% of the Yarawindah Brook Ni-Cu-PGE
project and 100% of the Mt Squires Au-Ni-Cu project.
We estimate
the value of OZL's bid to be A$0.18-A$0.19. The stock is currently trading
at A$0.16.
From our perspective, the CZI story has ended as
originally expected. Therefore, the stock has been removed from the SSWL.
It would be reasonable for CZI shareholders to sell their shares on
the market or hold for the takeover consideration. Selling now could make
sense for risk management purposes, but holding for completion of the
takeover would provide ownership of a nearly-free lottery ticket in the
form of Caspin shares.
Chart Sources
Charts appearing in today's commentary
are courtesy of:
https://stockcharts.com/
![]()