|
- Interim Update 24th July 2013
Copyright
Reminder
The commentaries that appear at TSI
may not be distributed, in full or in part, without our written permission.
In particular, please note that the posting of extracts from TSI commentaries
at other web sites or providing links to TSI commentaries at other web
sites (for example, at discussion boards) without our written permission
is prohibited.
We reserve the right to immediately
terminate the subscription of any TSI subscriber who distributes the TSI
commentaries without our written permission.
The Stock Market
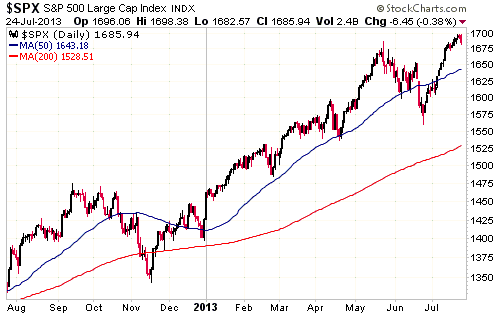
The recent slow upward drift in the S&P500 Index must be lulling
many stock market participants into a false sense of security. The price action
creates the impression that nothing untoward will happen.
We don't think that a major decline (a new bear market) will begin within the
next few weeks, but a sizeable (10%+) correction looks likely.
Gold and the Dollar
Gold
Why the gold bull market isn't over
If we had to give a one-line explanation for why gold's bull market is almost
certainly not over, it would be this:
Nothing has been learned.
A longer explanation would begin by pointing out that the Fed chairman and all
other senior members of the Fed, as well as most economists, politicians,
analysts, financial journalists and other commentators still believe that
economic weakness should be tackled by boosting the money supply. It's true that
some observers are concerned that the Bernanke-led Fed has gone too far with its
debt monetisation, but almost everyone who has reservations about current Fed
policy believes that it was right for the Fed to inject huge amounts of money
into the economy during 2008-2009 in response to the financial crisis and
recession of the time. Conventional wisdom is that it was only this aggressive
money-pumping that saved the US from a great depression.
Outside the growing but still relatively small "Austrian" school of economics
there is virtually no understanding of how monetary inflation adversely affects
the economy. Almost everyone outside the Austrian school believes that a rapid
rise in something called the "general price level" -- which, by the way, doesn't
actually exist in the real world -- is the only potential negative effect of
pumping money into the economy, and that monetary inflation will never be a
problem as long as the "general price level" is only rising slowly. Almost
everyone also believes that a decline in the "general price level" would be as
bad as a rapid rise in the "general price level". Heaven forbid that you should
be able to get more for your money as time goes by!
Only the Austrians understand that it's the distortions to relative prices
caused by monetary inflation, rather than the rise in some immeasurable average
price, that matters the most. To use an analogy, assume that a patient
experiences a 10% weight gain with all the gain concentrated in the right leg.
Doctors of the "Keynesian" and "Monetarist" schools would treat the patient's
body as an amorphous mass and only be concerned about the overall increase in
weight, whereas doctors of the "Austrian" school would focus on how the weight
gain is dispersed and would try to understand the implications of all the gain
being concentrated in the right leg. Using the same analogy, now assume that the
patient's head becomes 30% heavier, and that the increased weight of this one
part of the body is offset by decreased weight over the rest of the body such
that there is no change in overall weight. Doctors of the "Keynesian" and
"Monetarist" schools would perceive no cause for concern (because there has been
no change in overall weight), whereas doctors of the "Austrian" school would be
very concerned.
The persistent popular thinking that it is reasonable for the central bank to
ramp up the money supply in response to economic weakness and that monetary
inflation will never be a problem unless/until it causes a large rise in the
"general price level", all but makes a genuine economic recovery impossible. It
also guarantees that the inflation problem will continue to get worse until it
becomes blatantly obvious to everyone.
Summing up: Stupid, counter-productive policy-making is destined to continue.
Therefore, so is the gold bull market.
Current Market Situation
The gold bull market is destined to continue, but bull markets never go from
beginning to end in a straight line. The long-term gold bull market is probably
nearing the end of its first major correction.
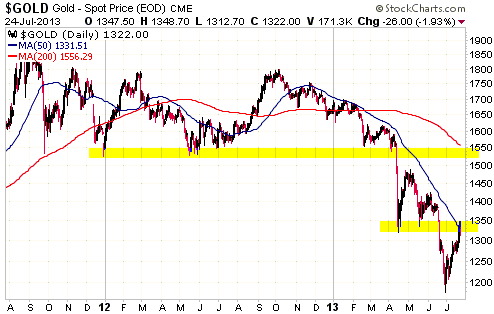
Preliminary evidence that the first major correction is nearing its end emerged
over the past three trading days. The evidence is that the current rebound has
already been stronger than the rebound that followed the April low. The top of
the $1320-$1350 resistance range hasn't yet been breached, but the fact that it
has been tested differentiates the current rebound from the preceding one.
If gold is able to overcome resistance at $1350 within the next two weeks then
by early September it should rise to around $1400 and could rise as high as
$1500. The stage would possibly then be set for a decline to an October-November
low.
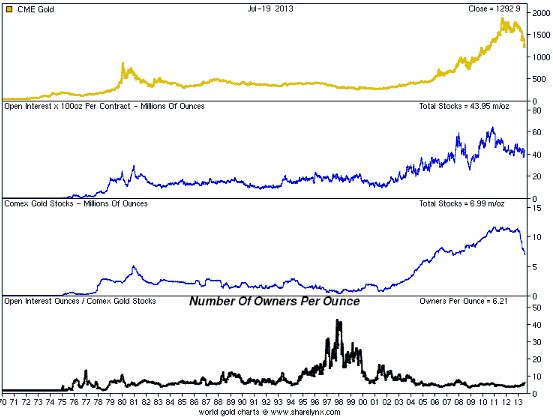
The following two gold-related charts from the excellent
sharelynx.com web site are topical.
The first chart covers the entire period from 1970 to the present and is split
into four sections. From top to bottom, these sections show the US$ gold price,
the COMEX open interest converted to millions of ounces (the number of open
100-oz futures contracts multiplied by 100), the COMEX gold inventory in
millions of ounces, and the COMEX open interest relative to the COMEX gold
inventory. The chart indicates that:
1) Over the long-term, the COMEX gold inventory has tracked the gold price.
2) Considering the long-term relationship between inventory and price, this
year's sharp decline in the COMEX gold inventory is not strange (it is
consistent with the price action).
3) On a long-term basis the current open interest in COMEX futures is not
unusually high relative to the COMEX gold inventory, or, to put it another way,
the current COMEX gold inventory is not unusually low relative to the open
interest.
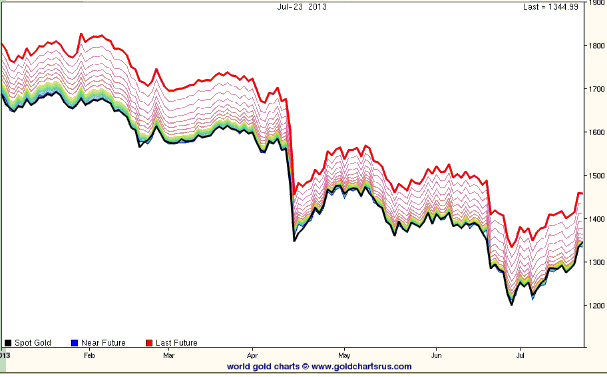
The second chart shows the gold futures spread since the beginning of this year.
This is a picture of a commodity market in "contango", in that the more distant
the delivery time or expiry date, the higher the price.
The occasional small dips by the nearby futures (the blue line) to below the
spot price (the black line) have generated excitement in some quarters and led
to the tout that the gold market is in "backwardation" (the opposite of "contango").
However, we explained in previous TSI commentaries that when short-term US$
interest rates are close to zero it will be possible for a minor fluctuation in
the price of the nearby futures relative to the spot price to cause the futures
price to dip below the spot price. This is a mole hill, not a mountain.
Gold Stocks
Over the past five months we've done plenty of selling in the gold-mining
sector, but none of the selling was prompted by the emergence of good
profit-taking opportunities. It generally involved the selling of relatively
low-quality gold stocks to enable our exposure to relatively high-quality gold
stocks to be increased while keeping our cash reserve at a comfortable level
(for us, minimum cash level is 20%-25% of total portfolio value). However, there
is evidence in the recent price action that the gold-mining sector is in the
early stages of becoming a more normal market -- a market that occasionally
offers-up good selling opportunities as well as good buying opportunities. Chief
among this evidence is the fact that for the first time since the steep downward
trend got underway in the final quarter of last year, the HUI has closed above
the low of an earlier consolidation (in this case, the low of the April-May
consolidation). Also worth noting is that the HUI has just closed above its
50-day moving average for the first time since last October.
That the current rebound is overcoming obstacles that were not overcome during
earlier rebounds points to a change of character. It suggests that the major
trend is in the process of reversing.
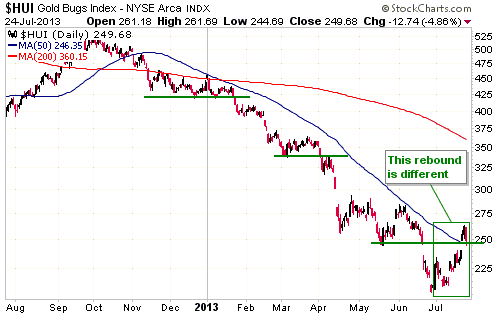
Note that some corrective activity and a decline by the HUI to below its 50-day
MA over the days ahead wouldn't negate the above-mentioned evidence that the
major trend is in the process of reversing.
Currency Market Update
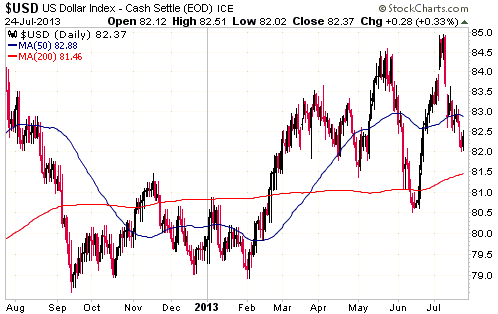
We don't know what to make of the Dollar Index's performance since early May. It
first moved sharply higher, then sharply lower, then sharply higher again, then
sharply lower again, and is now back to where it started. If the decline of the
past three weeks was a routine correction then it would ideally have ended at or
above 82.5, but it didn't.
An effect of this confusing price action is that we are confused. There is
nothing to be done except wait for additional information (new clues) to emerge.
Update
on Stock Selections
Notes: 1) To review the complete list of current TSI stock selections, logon at
http://www.speculative-investor.com/new/market_logon.asp
and then click on "Stock Selections" in the menu. When at the Stock
Selections page, click on a stock's symbol to bring-up an archive of
our comments on the stock in question. 2) The Small Stock Watch List is
located at http://www.speculative-investor.com/new/smallstockwatch.html
 International
Tower Hill Mines (NYSE: THM, TSX: ITH). Shares: 98M issued, 103M fully diluted.
Recent price: US$0.41 International
Tower Hill Mines (NYSE: THM, TSX: ITH). Shares: 98M issued, 103M fully diluted.
Recent price: US$0.41
On 24th April we wrote: "The FS [Feasibility Study] will provide the first
indication of the economics of developing Livengood into a mine, the reasons
being that the company bypassed the PFS phase and the PEA completed in
August-2011 is no longer relevant (due to substantial changes in mine plan and
costs)." THM announced the results of the long-awaited Feasibility Study for
its Livengood gold project (Alaska) after the close of trading on Tuesday 23rd
July.
According to the FS, Livengood has a large in-ground gold inventory (about 10M
gold ounces in the Proven and Probable reserve category) with the potential to
be developed into a mine that produces an average of 578K ounces of gold per
year over a 14-year mine life. Unfortunately, the FS reveals a high initial
capital cost ($2.8B) and a high all-in production cost ($1474/oz). As a result
of the project's high cost structure, the large in-ground gold resource cannot
be economically extracted at anywhere near today's gold price. In fact, at the
currently-estimated costs the project would require a gold price of more than
$2000/oz to become economically viable.
The Livengood economics revealed by the FS were much worse than we expected. We
expected that the project would be marginal at best with gold in the $1300s, but
that it would be viable at a gold price of $1500-$1600. Also, we wrongly thought
that the mine plan would be based on a staged development, beginning with a
relatively low-capital-cost starter pit.
The cost structure can almost certainly be improved. Of particular note, due to
reduced demand for labour and equipment the costs of building and operating a
gold mine began trending downward a few months ago and will probably continue to
decline for another 6-12 months. However, it is clear that THM has effectively
become a well-out-of-the-money long-dated call option on the gold price. It's a
good bet that there will be a massive advance in the price of THM shares after
it becomes obvious to the speculating herd that the gold price is headed to new
highs, but in the meantime a THM shareholding will be 'dead money'.
THM has been clobbered in the stock market over the past year and by some
measures is now incredibly cheap. For example, its enterprise value is now about
$20M, which means that its P&P gold reserves are being valued at only $2/ounce.
However, there are other gold-mining companies with better projects that are
also incredibly cheap. It therefore doesn't make sense to have substantial
exposure to this stock, although it could be appropriate to retain a small
position on the basis that a) the company has enough cash to keep itself going
for two more years at a reduced burn rate, and b) two years from now the gold
price will probably be at or close to a new all-time high.
We have decided to retain a small amount of exposure to THM in our own
portfolio, but have removed it from the TSI Stocks List and recorded a large
(90%+) loss.
 New TSI stock selection: Sprott Inc. (TSX: SII). Shares: 248M.
Recent price: C$2.37
SII is a provider/manager of mutual funds and other wealth
management products. It was recently brought to our attention (as an
investment opportunity) by Ross Clark of
Institutional
Advisors.
As per the company's web site, SII's investment themes include
natural resources, precious metals, opportunistic equity, small cap,
enhanced equity and specialty fixed income. Alternative equity and
income investment strategies include long/short equity, long/short
equity and income, long/short fixed income and foreign exchange,
long-biased small cap, market neutral and private credit. Investment
vehicles include mutual, hedge, offshore and closed-end funds as
well as managed accounts and tax efficient corporate class funds and
flow through limited partnerships.
The company's major shareholders are Eric Sprott, the company's
chairman, and Rick Rule, a director. Eric Sprott owns 94M shares
(38%) and Rick Rule owns 25M shares (10%). Some of the most
important company insiders therefore have a lot of 'skin in the
game'.
SII's price chart reveals a roller-coaster ride. The stock price
went from $9 in early-2008 down to a low of $2.06 in late-2008 up to
$9 in early-2011 down to a recent low of $2.21. It closed at C$2.37
on Wednesday 24th July, so it is presently not far from this year's
low and its 2008 crash low.
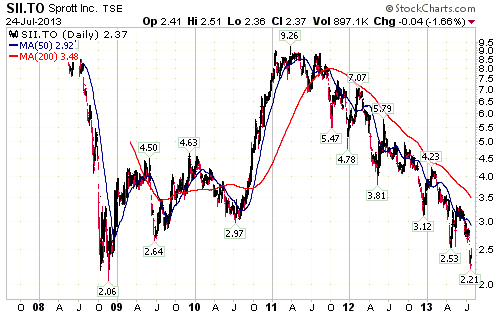
The fact that SII has fallen back to within spitting distance of its
2008 crash low doesn't, by itself, make the stock a buy. What makes
the stock a buy is that this a very solid company with excellent
leadership, about $9B of assets under management and almost $300M of
working capital that has temporarily fallen so far out of favour
that it is trading near a 6-year low.
We don't expect the rebound from this year's low to be as rapid as
the rebound from the 2008 low, but the upside potential over the
coming 1-3 years is much greater than the remaining downside
potential. The remaining downside potential is linked to the risk
that commodity markets haven't yet bottomed and that a large stock
market decline lies ahead. Also, there's a risk that the company
will report losses for its June-2013 and September-2013 quarters,
possibly leading to its $0.03 quarterly dividend being temporarily
suspended. However, it looks like these risks have been factored
into the stock price. In any case, new investors in SII shares can
manage risk by scaling into a position over the coming few months,
perhaps beginning with an initial purchase near the current price.
 Quick comment on Lydian International (LYD.TO)
LYD announced some bad news on Wednesday 24 July that caused its
stock price to plunge. We'll discuss the news in the Weekly Update.
One effect of the news will be a significant delay to the completion
of the updated Feasibility Study for the company's Amulsar gold
project in Armenia, but we don't yet have enough information to
fully assess the effects. Although our initial reaction to the
decline in the stock price is that it's a terrific buying
opportunity, we wanted to point out that it usually isn't a good
idea to buy immediately following a stock-specific news-related
plunge. That's especially the case when the full implications of the
news are unknowable. In other words, there should be no urgency to
undertake new buying.
Chart Sources
Charts appearing in today's commentary
are courtesy of:
http://stockcharts.com/index.html
http://www.sharelynx.com/

|

