|
- Interim Update
24th September 2014
Copyright
Reminder
The commentaries that appear at TSI
may not be distributed, in full or in part, without our written permission.
In particular, please note that the posting of extracts from TSI commentaries
at other web sites or providing links to TSI commentaries at other web
sites (for example, at discussion boards) without our written permission
is prohibited.
We reserve the right to immediately
terminate the subscription of any TSI subscriber who distributes the TSI
commentaries without our written permission.
Could a
central bank ever be a force for good?
The following paragraph from John
Hussman's
latest weekly letter is brilliant. It explains, as succinctly as
it is possible to do so, why the actions taken by the US Federal
Reserve have generally been counterproductive.
"The standard of living of a country is measured by the amount of
output that individuals are able to consume as a result of their
work. The productivity of a country is measured by the amount that
individuals are able to produce as a result of their work. Over
time, growth in the standard of living is chained to and limited by
growth in productivity. Productivity, in turn, rests on two factors:
a productive capital base, and an active pool of productive domestic
labor. The accumulation of productive factors is what drives
long-term growth. When the most persistent, most aggressive, and
most sizeable actions of policymakers are those that discourage
saving, promote debt-financed consumption, and encourage the
diversion of scarce savings to yield-seeking financial speculation
rather than productive investment, the backbone that supports a
rising standard of living is broken." [Underlining added]
However, the same Hussman letter contains the following wrongheaded
comment:
"...deficit spending and monetary stimulus can be appropriate as
a sort of short-run "kindling" to ease constraints on the economy
that would otherwise be binding."
Many of the people who understand the problems that have been
created over the past 14 years by the Fed and other central banks
unfortunately believe that a central bank could be a force for good
if only it were run in a prudent manner. This belief is misguided
for three main reasons.
First, there are never any constraints on a free economy that could
be eased by deficit spending and monetary stimulus. The constraints
that could supposedly be addressed by some form of artificial
stimulus only arise due to the creation of money out of nothing by
the central bank or the commercial banks. This is a practice that
either could not happen (there would be no central bank) or would
not legally be able to happen (it's unlikely that counterfeiting by
banks, a.k.a. fractional reserve banking, would be condoned) in a
free economy.
Second, fiscal and monetary stimuli always lead to bigger problems
than the problems they are supposed to address. This is because an
increase in government spending necessarily involves greater
government theft and politically-motivated wealth transfers, and
because monetary stimulus always generates false price signals that
ultimately make the economy less efficient. Policies that bring
about undeserved wealth transfers and get in the way of genuine
price discovery cannot possibly help under any circumstances.
Third, if a central bank is given the special power to inject money
into the economy and manipulate interest rates under certain
conditions, such as during a banking crisis, the power will
eventually be abused to the point where the central bank comes to
dominate the economy. It is an inevitable transformation that is
bound to occur regardless of whether the central bank is
government-owned or privately-owned. The only unknown is how long it
will take. In the US it took 95 years, if we mark 2008 as the year
in which the Fed came to totally dominate the economy.
Further to the above, the idea that a prudently-managed central bank
could be a net benefit to the overall economy is naive, to put it
mildly. It is akin to the belief that the only reason socialism has
never worked is that the right people haven't been in charge.
Sentiment and momentum
extremes
A number of markets are currently at sentiment
and momentum extremes. Generally, the Dollar Index is very extended to the
upside in terms of both sentiment and momentum, whereas the markets that benefit
from a weaker US$ are very extended to the downside in terms of both sentiment
and momentum. With regard to the markets that are stretched to the downside,
here are some of the most extreme cases based on Market Vane bullish percentages
and daily RSIs (Relative Strength Indexes) over the first three days of this
week. Note that a market is considered to be 'oversold' when its daily RSI(14)
drops to 30, while a daily RSI reading of 20 or lower is a rarely-reached
extreme.
1) The following extreme daily RSI(14) readings were recorded during the past
three days:
- 19.2 for the Continuous Commodity Index (CCI)
- 16.6 for the TSXV Venture Exchange Composite Index (CDNX), a proxy for
junior Canadian resource stocks
- 14.5 for platinum
- 16.2 for silver
- 20.2 for the silver/gold ratio
- 16.2 for the Yen (note: the daily RSIs for the euro and the Pound went
below 20 earlier this month, but are now a little higher)
2) The following extremely low Market Vane bullish percentages were recorded
over the past three days:
- 22% for silver (the lowest level in more than 10 years and possibly a
multi-decade low)
- 20% for corn
- 14% for wheat (one of lowest levels ever, in any market)
Negative sentiment and momentum extremes do not necessarily mean that a price
low is imminent. The meaning is that there will be a lot of potential energy to
drive a rally after the price trend reverses.
The Stock Market
The S&P500 Index (SPX) reversed lower last Friday and declined
over the first two days of this week. It then rebounded from short-term support
at 1976-1980 on Wednesday.
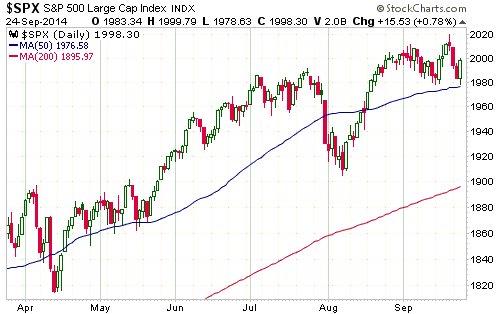
The SPX is currently down by only 1% from its all-time high and is yet to breach
any support of significance. It therefore wouldn't surprise us to see it move to
a new all-time high within the coming fortnight. At the same time, the bearish
divergences and non-confirmations are continuing to pile up. For example,
Wednesday's rally by the SPX to within 1% of its all-time high was accompanied
by 221 new 52-week lows by individual stocks and only 49 new 52-week highs by
individual stocks across the NYSE and NASDAQ markets.
The current overall situation in the US stock market suggests that the SPX could
make a new all-time high within the next two weeks, but that any new high will
be marginal and will not be confirmed by market internals and many other equity
indices.
Gold and the Dollar
Gold and Silver
Gold relative to silver during precious-metals bull markets
It is widely believed that silver outperforms gold during bull markets for these
metals, but that's only partially true. It's true that silver tends to achieve a
greater percentage gain than gold from bull-market start to bull-market end.
It's also the case that silver tends to do better during the final year of a
cyclical bull market and during the late stages of the intermediate-term rallies
that happen within cyclical bull markets. However, the early stages of
gold-silver bull markets tend to be characterised by relative strength in gold.
This is a point we've made in the past, including in TSI commentaries earlier
this year, but warrants revisiting due to the recent price action.
The point we are trying to make is established by the following long-term chart
of the gold/silver ratio. The boxes labeled A, B and C on this chart indicate
the first two years of the cyclical precious-metals bull markets of 1971-1974,
1976-1980 and 2001-2011, respectively. Clearly, gold handily outperformed silver
during the first two years of each of the last three cyclical precious-metals
bull markets that occurred within secular bull markets. Therefore, while
silver's recent weakness relative to gold certainly doesn't guarantee that a new
cyclical bull market began last December, it is not inconsistent with our view
that a new bull market began at that time.

The above chart indicates that this year's continuing upward trend in the
gold/silver ratio (continuing weakness in silver relative to gold) is not in
conflict with the view that gold commenced a cyclical bull market last December
and is working its way through a lengthy basing process. But what about silver's
recent break to a new bear-market low in US$ terms? Does this negate the
cyclical gold bull market view?
The answer is a qualified no. Silver's breakdown is definitely not, in itself, a
reason to believe that the metals are immersed in an extended basing process,
but it is also not unprecedented for the early part of a cyclical gold bull
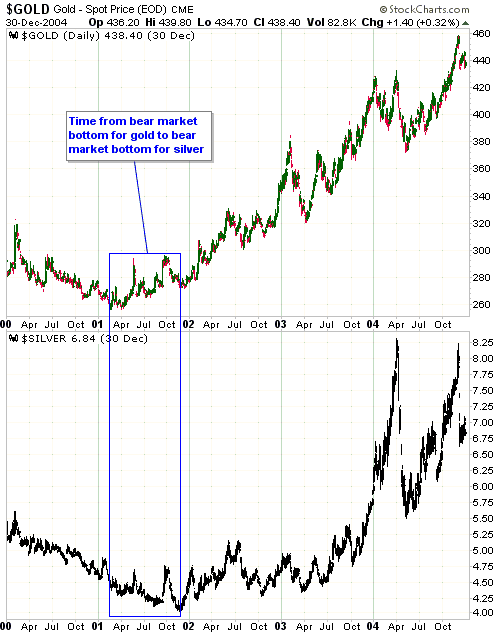
market. As evidence we present the following chart showing how gold and silver
performed during 2000-2004. Notice that gold made its ultimate bear-market
bottom (and commenced a new cyclical bull market) in February of 2001, but
silver didn't make its ultimate bear-market bottom until November of 2001.
Silver's performance in November of 2001 is another example of a long-term
decline ending soon after an important support level is breached.
Current Market Situation
The gold price broke below support defined by its June low during the week
before last and hasn't yet signaled an end to the short-term downward trend.
It's worth noting that the US$ gold price has just accomplished another "death
cross" (the 50-day MA has crossed from above to below the 200-day MA). Death
crosses often occur near short-term price bottoms, and despite their name are
therefore usually bullish. For example, gold's previous "death cross" at the end
of May turned out to be a short-term bullish signal, as we said at the time
would likely be the case. However, when there is a "death cross" followed by a
"golden cross" followed by another "death cross", as per the current situation
in the gold market, the second "death cross" is not a reliable bullish signal.
This doesn't mean that gold is not very close to a short-term bottom; it means
that the "death cross" of the past few days doesn't constitute evidence of an
impending price bottom.
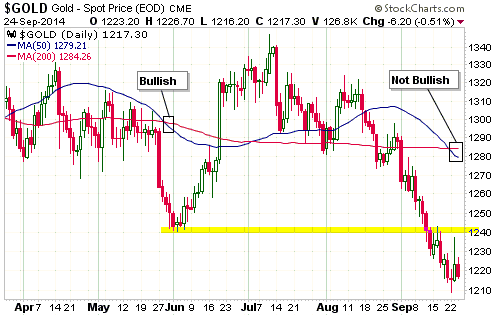
Gold will probably begin to rally soon -- if not this week then in
early-October. However, if the fundamentals don't start moving back in gold's
favour then any rally over the coming 1-2 months will be within the context of
the drawn-out basing process that got underway in June of last year.
For the fundamentals to start moving back in gold's favour, the S&P500 Index
will probably have to start trending downward.
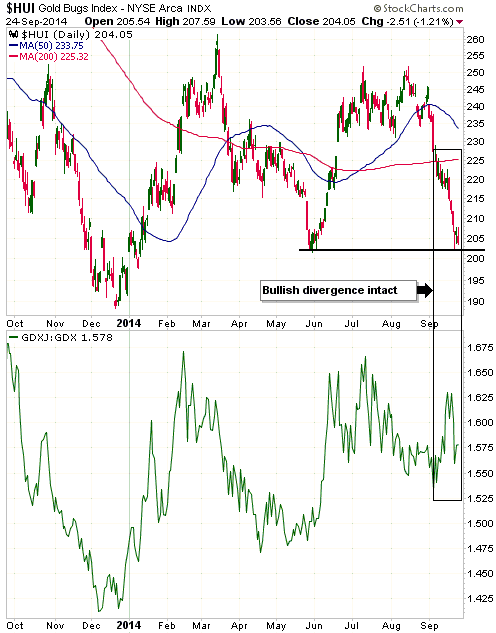
Gold Stocks
The following chart shows that the HUI is testing lateral support defined by its
early-June low. The chart also shows that the GDXJ/GDX ratio took a hit on
Monday due to substantial relative weakness in GDXJ, but that the bullish
divergence between the HUI and GDXJ/GDX that began to develop in early-September
remains intact.
As is the case with gold bullion, the gold-mining sector will probably begin to
rally soon. But as is also the case with gold bullion, there is not yet any
evidence that a short-term price bottom is in place.
With regard to the price action that would constitute evidence of a short-term
price bottom, we have some specifics in mind, but the numbers change every day
based on what happened that day. Suffice to say right now that as long as the
bullish divergence between the HUI and the GDXJ/GDX ratio remains intact, it
won't take much strength from here to signal a multi-week turn to the upside.
Updates
on Stock Selections
Notes: 1) To review the complete list of current TSI stock selections, logon at
http://www.speculative-investor.com/new/market_logon.asp
and then click on "Stock Selections" in the menu. When at the Stock
Selections page, click on a stock's symbol to bring-up an archive of
our comments on the stock in question. 2) The Small Stock Watch List is
located at http://www.speculative-investor.com/new/smallstockwatch.html
Chart Sources
Charts appearing in today's commentary
are courtesy of:
http://stockcharts.com/index.html

|
