![]()
![]()
![]()
![]()
- Interim Update 25th January 2017
Copyright
Reminder
The commentaries that appear at TSI
may not be distributed, in full or in part, without our written permission.
In particular, please note that the posting of extracts from TSI commentaries
at other web sites or providing links to TSI commentaries at other web
sites (for example, at discussion boards) without our written permission
is prohibited.
We reserve the right to immediately
terminate the subscription of any TSI subscriber who distributes the TSI
commentaries without our written permission.
The uranium sector has
gone from depressive to manic
Although the rally in
uranium-mining stocks only got underway in November, it is already getting
silly.
The uranium-mining sector received a reality check a week
ago when Cameco, its most important member, reported lousy results for
2016 and issued a lousy forecast for 2017, causing the prices of most
uranium stocks to drop sharply from their 'overbought' levels. Reality was
quickly abandoned, though, and the prices of most uranium stocks have
since moved well above their pre-Cameco-news peaks despite there being no
supporting increase in the price of the underlying commodity.
Below
is a chart of URA, an ETF proxy for the uranium-mining sector. Relative to
its $115 peak back in early-2011, URA has barely moved from its November
bottom. On a long-term basis it is therefore far from being stretched to
the upside. However, the last time it traded at its current price the spot
price of the underlying commodity (U3O8) was about $36/pound. The current
spot price of U3O8 is only $23/pound, which suggests that investors -- and
we use the word "investors" in the loosest possible way -- have bid up URA
to the point where a 50% increase in the U3O8 price has been fully
discounted.

It occurred to us that it could make sense to do a spread trade that
involved buying uranium via U.TO (the Uranium Participation Fund), a
closed-end fund that holds physical uranium, and short-selling URA, but we
quickly went off this idea when we discovered that U.TO was trading more
than 10% above its net asset value (NAV).
Iron-Ore Thoughts
Over the past 12 months we've
paid a lot more attention to iron-ore than we normally would. The reason
is that its price action has been very interesting and remains so. This
week the price made a new 2-year high.
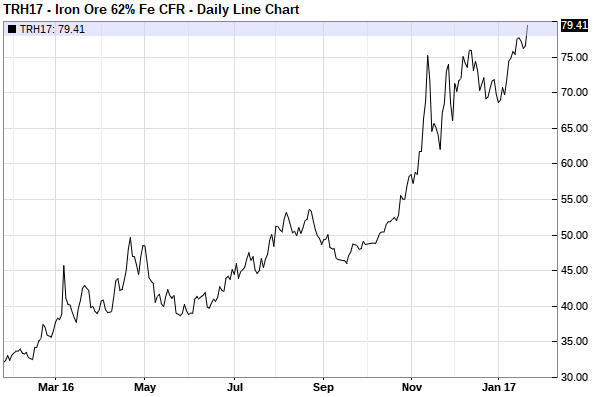
Iron-ore's price action has been interesting in two ways. First, the
huge rebound from the early-2016 bottom has been representative of a
growing belief in a so-called "reflation trade"*. Second, the entire price
rebound has occurred in the face of fundamentals-oriented analysts at
major banks/brokerages** calling for an imminent return to the early-2016
low or lower. Supposedly, there is too much supply relative to demand.
We don't see any reason to be long-term bullish on iron-ore, because
the production costs of the major iron-ore producers are low and the
supply that could be brought onto the market in response to higher prices
is virtually unlimited. However, at no time over the past year has there
been too much readily-available supply relative to demand. If there had
been then the price wouldn't have gone up. Furthermore, the only realistic
way to assess the current supply of an industrial commodity relative to
its demand is to look at the market's term structure (the differences
between the prices for earlier and later delivery). For example, if the
price for immediate delivery (the spot price) is well above the price for
delivery in 6 months, that is, if there is significant backwardation, then
we can reasonably conclude that the current supply/demand situation is
price-bullish.
As we write, the spot iron-ore price is about
$83/tonne, the price for delivery in 6 months is about $73/tonne and the
price for delivery a year from now is about $65/tonne. The supply-demand
fundamentals will change, but this "term structure" implies that they are
currently bullish.
The only TSI exposure to iron-ore is via Adriana
Resources (ADI.V), which is in the process of merging with Sprott Resource
Corp. (SCP.TO). ADI's share price was boosted when the merger was first
announced, but due to the stock market's increasing enthusiasm for
iron-ore plays it is probably now being held back by the merger. As
previously advised, the fair price for a pre-merger ADI share is slightly
more than one-third the price of an SCP share. However, both ADI and SCP
are significantly under-valued based on net asset calculations.
*We don't like this expression because you can't reflate if you have
never deflated, but most economists, financial journalists and central
bankers are unable to recognise inflation as long as its effects are
concentrated in the prices of stocks, bonds and real estate. It is
therefore possible to have massive rises in the prices of financial assets
and still have something called a "reflation trade" after the commodity
markets join the party.
**Including Goldman
Sachs, prior to a recent belated upgrade.
The Stock Market
The US
A
lot of pundits were expecting a stock market reality check to happen
immediately after Trump's inauguration, leading to a substantial sell-off.
The fact that it was such a popular expectation is probably why it didn't
happen.
There's a good chance that the reality check will happen
within the first few months of this year, but beyond that the timing isn't
clear. As we noted in the latest Weekly Update, with the market no longer
'overbought' and with sentiment indicators mixed, a post-Inauguration
multi-week surge was just as likely as a meaningful decline.
Talking of sentiment indicators, the TSI Put/Call Indicator (the 10-day MA
of the equity put/call ratio divided by the 10-day MA of the OEX put/call
ratio) moved into the BUY zone early this week. Refer to the following
chart for details. This suggests that we should be less worried about
short-term downside risk than we are and warns against making aggressive
bearish bets.
To be honest, we are having a hard time believing the put/call
indicator's current bullish posture, but it is what it is.
On
Wednesday 25th January the Dow Industrials Index achieved the
widely-anticipated 20,000 milestone. This opens up the possibility of a
bearish signal in the form of a breakout failure, but we shouldn't assume
that the breakout will fail. Instead, the break above 20,000 should be
accepted as genuine until/unless it proves otherwise.
Gold and the Dollar
Gold
In
terms of effect on the gold price, the recent minor weakness in the Dollar
Index has been offset by slightly greater weakness in the T-Bond. Like the
US$ gold price, the bond/dollar ratio is in consolidation mode. We expect
that they will both soon resume their short-term rallies, but we have no
opinion on whether it will happen immediately or after some additional
consolidation.
If the consolidation continues then the gold price
should find support near its 50-day MA (the blue line on the following
chart), which is presently near $1180.
Keep in mind that the fundamental backdrop remains gold-bearish. It
became slightly less bearish in December, mainly due to a quick decline in
the real US interest rate, but it is presently not supportive of anything
more than a 2-3 month rebound.
Gold Stocks
Although the HUI made a new intra-day high and a new closing high for the
year during the first half of this week, it makes sense to view all the
price movements since 5th January as being part of a consolidation with a
slight upward bias. We expect that after this drawn-out consolidation
eventually ends there will be a rise to as high as 250. That's regardless
of whether the long-term trend is now bullish or bearish.
That this week's rise was part of an on-going consolidation rather
than a breakout is clearer in the following chart of GDXJ than in the
above chart of the HUI. For GDXJ, the upper end of the consolidation range
is defined by the 200-day MA. This MA has been tested almost daily since
5th January and hasn't yet been breached on a closing basis.
Obviously, GDXJ needs to achieve a solid daily close above its 200-day MA
to signal the start of its next upward leg.
By the way, GDXJ's performance over the past three weeks is an example
of how the price of an ETF can affect the prices of its component stocks
rather than simply being a passive reflection of its component stocks. It
is clear that a lot of traders have been selling GDXJ near its 200-day MA,
undoubtedly based on the belief that this is a natural place for the rally
to end. Given that ETFs always trade very near their net asset values
(NAVs), the selling of GDXJ near its 200-day MA must have caused sales of
its component stocks in order to keep the ETF's NAV in line with its
market price.
The Currency Market
The
Dollar Index's short-term correction is still in progress. It could extend
as far as 97.5 without doing significant technical damage to the
intermediate-term upward trend, but there is strong support at around 100
that is now being tested and could limit the downside.
In the UK, the Supreme Court ruled early this week that parliamentary
approval is needed to trigger "Article 50" of the Lisbon Treaty (the
article that must be triggered to officially begin the process of
extricating the UK from the EU). This could delay the start of the
separation process, although parliamentary approval will almost certainly
be granted and the British PM's target of triggering the article by the
end of March is still achievable.
As is becoming the norm, the
currency market took this Brexit-related news in stride. The Pound has
broken above its 50-day MA and is probably on its way to lateral
resistance near 127.5.
Updates on Stock Selections
Notes: 1) To review the complete list of current TSI stock selections, logon at
http://www.speculative-investor.com/new/market_logon.asp
and then click on "Stock Selections" in the menu. When at the Stock
Selections page, click on a stock's symbol to bring-up an archive of
our comments on the stock in question. 2) The Small Stock Watch List is
located at http://www.speculative-investor.com/new/smallstockwatch.html
![]() Exiting
Taseko Mines (TGB) at US$1.47
Exiting
Taseko Mines (TGB) at US$1.47
TGB has gained 73% since the
beginning of this year and 172% since being added to the TSI Stocks List
last July. It has served its purpose of providing leveraged exposure to a
rise in the copper price and is close to the upside target we had in mind
when it was added to the List (we wrote at the time that a rise in the
copper price to $3, which was expected to happen in 2017, would
potentially triple the price of TGB shares). This is therefore a
reasonable time to remove TGB from the TSI List.
Note that if you
own TGB shares and have no other exposure to copper then it could make
sense to retain part of your TGB stake. Despite its weak balance sheet and
mediocre management, it will be a 'go to' stock for the speculating
community if the copper price continues to rise.
Our preference at
this time is to own copper-mining stocks that aren't quite as leveraged
and have less downside risk, such as the two stocks described below.
Neither of these copper stocks is being added to the TSI List right now,
but both are potential future additions. Our tentative plan is to add one
of these stocks following a short-term correction.
 Two Australia-listed copper producers worth considering
In general, gold-mining stocks listed in Australia currently offer
much better value than similar stocks listed in Canada and/or the US.
Also, copper-mining stocks listed in Australia generally offer better
value at this time than their North-America-listed counterparts. That's
been the case for a while and is why we have written about more
Australia-listed mining stocks over the past 12 months than we ever have
before.
We expect that the copper price will suffer a substantial
multi-month decline from whatever high it makes during the first quarter
of this year, but it could rise to $3 before turning downward and if so
the Q1 peaks in the stock prices of many copper miners could be well above
current levels. We also expect that the copper price will recover from the
aforementioned multi-month decline and be above its current level ($2.70)
by year-end. This copper-market outlook is strongly influenced by our
currency-market outlook.
Further to the above, what we want are
stocks that a) provide exposure to upside in the copper price, b) are
under-valued at the current copper price, and c) have strong-enough
balance sheets and low-enough production costs that the copper price
temporarily returning to the low-US$2 area would not create a financial
problem. Here are two Australia-listed copper miners that fit the bill.
1) Avanco Resources (ASX: AVB). Shares: 2,457M. Recent
price: A$0.072
Despite having the share price of a "penny
dreadful", thanks to having roughly a gazillion shares outstanding (2.46B,
actually) AVB is not a microcap. At its recent share price of A$0.072 it
has a market cap of A$177M, or about US$130M.
As an aside, AVB's
absurdly-high share count is not unusual for an Australia-listed junior
resource company. However, it would make sense for the company to do a
1:20 share consolidation and then list the shares in Canada. This would
not alter the value of the total company, but it could substantially
increase the stock market's valuation of the company.
AVB has two
mining assets of significance, both of which are located in Brazil. The
more important of these assets is the Antas open-pit copper mine. The mine
is currently producing copper at the rate of about 26M pounds/year, and
production is expected to increase to about 37M pounds/year within two
years. The company's management sees the potential to grow production to
more than 100M pounds/year in 5 years, but that's not something that
should be factored into the valuation at this time.
At a little
above 2% copper, the average resource grade is relatively high for an
open-pit mine. The relatively-high grade is translating into
relatively-low costs, as the current AISC is only about US$1.60/pound.
This means that the Antas mine is very profitable at today's copper price.
Assuming an annual production rate of 32M pounds (about half way
between the current rate and the 1-2 year target), a total production cost
of US$1.90/pound (a conservative guess based on the current $1.60/pound
AISC) and a copper price of US$2.50/pound, we come up with an annual
cash-flow estimate of US$19M for Antas. Applying an 8-times cash-flow
multiple then results in a valuation of US$152M for the asset.
The
other asset worth mentioning is an exploration/development-stage gold
project called CentroGold. This project was formerly called Gurupi and was
owned by Jaguar Mining. To be accurate, it is still owned by Jaguar, but
AVB and Jaguar have done a deal whereby AVB can earn 100% of the project
by making a small up-front payment of US$2.2M and then paying $12.50 per
reserve ounce prior to the start of mine construction.
Jaguar
defined a 3.1M-ounce resource for the CentroGold project, but AVB is
directing its attention to one part of the overall resource with the aim
of coming up with a scalable, low-capex mine plan. Its efforts to date
have defined a resource comprising 1.3M ounces of 2-g/t gold that will
form the basis of a scoping study (PEA).
The main reason that AVB
has obtained the rights to this multi-million-ounce gold project so
cheaply is the permitting difficulty encountered by Jaguar. However, AVB's
senior managers/directors, all of whom are Portuguese-speaking and Brazil
residents, are confident that they can resolve the permitting issues.
We don't like assigning values to gold projects by multiplying the
number of in-ground ounces by an arbitrary price per ounce, but prior to
AVB completing its PEA it's the only valuation method available to us.
Based on the 1.3M ounces defined by AVB's initial work on the project and
an unaggressive US$30/ounce price for the resource, we arrive at a
valuation of US$39M for the asset.
We therefore value AVB's mining
assets at US$191M ($152M + $39M), or A$255M. AVB also has net cash of
A$20M, bringing us to a total company value of A$275M. This equates to
11.2 cents/share, or a little more than 50% above the current share price.
AVB's stock price has spent the past 2 years building a base in the
A$0.05-$0.085 range.
2) Sandfire Resources (ASX: SFR). Shares: 158M. Recent
price: A$6.31
SFR owns the high-grade, underground
DeGrusso copper-gold mine, located in the world's lowest-risk place for
mining (the 'outback' of Western Australia). The mine produces copper at
the rate of around 150M pounds/year at a low cash cost of around
US$0.95/pound.
The reported operating cost is dragged down by a
significant gold byproduct, in that the mine is also producing about 40K
ounces/year of gold. All else remaining the same, the higher the gold
price the lower the reported copper production cost.
The mine's
reserve (8M tonnes grading 4.4% copper) is enough for about 5 years of
additional production at the current run rate, but management expects to
extend the mine life by finding additional high-grade copper in nearby
deposits.
SFR already has a strong balance sheet, with net cash of
A$57M at the end of December, but the balance sheet is getting stronger at
a quick pace due to the fact that the mine is generating a lot of cash at
the current copper price.
Assuming a copper price of US$2.50 and an
A$/US$ exchange rate of 0.75, we estimate that SFR will have positive
cash-flow of at least A$200M this year. Applying the same 8-times
cash-flow multiple we used for AVB and adding the $57M of net cash gives
us a rough value of $1650M, or A$10.44/share, for the company. This is 65%
above the current stock price.
The biggest SFR-specific risk is
that almost all of the company's value is associated with a single mine.
Political risk is as low as it gets and the mine is operating smoothly,
but with any mining operation, especially an underground mining operation,
there will always be some chance of a major problem that stops or
substantially reduces production.
SFR's stock price has built a
long-term base. The top of the base is around A$7.00.
Chart Sources
Charts appearing in today's commentary
are courtesy of:
http://stockcharts.com/index.html
http://www.barchart.com/
http://bigcharts.marketwatch.com/
![]()