|
- Interim Update 25th February 2004
Copyright
Reminder
The commentaries that appear at TSI
may not be distributed, in full or in part, without our written permission.
In particular, please note that the posting of extracts from TSI commentaries
at other web sites or providing links to TSI commentaries at other web
sites (for example, at discussion boards) without our written permission
is prohibited.
We reserve the right to immediately
terminate the subscription of any TSI subscriber who distributes the TSI
commentaries without our written permission.
China
China's economic miracle?
China's strong economic growth contributed
to the surge in commodity prices over the past year and the consensus view
is that burgeoning Chinese demand for metals, grains and oil will cause
further sharp gains in prices over the coming 6-12 months. We, however,
consider China to be a wildcard as far as the commodity markets are concerned
because China's strong growth is being fueled by a massive expansion of
credit and all credit-induced booms end in busts. In China's case the question,
we think, is not if a bust will occur but when it will occur. Unfortunately,
we don't have the answer to that question; all we can say is that it doesn't
make sense to blindly assume that China is going to power ahead over the
remainder of this decade or even the remainder of this year.
When a country is immersed in an economic
boom its systemic flaws seem unimportant, or, at least, temporarily fade
into the background. This has certainly been the case with China because
its strong growth has taken the focus of many analysts and investors away
from the country's dismal record in the area of individual rights and directed
it towards the few concessions made by the Chinese government to entrepreneurship.
It is worth remembering, though, that China's government does not tolerate
any opposing views, so there is no freedom of speech and very little freedom
of information in China. And that China has a weak banking system as a
result of the banks having been forced, over the years, to lend huge sums
of money to poorly-run state-owned enterprises. These problems don't seem
important now, but they will once the rate of credit expansion slows (as
it eventually must).
It is also worth noting that China's
one-child policy has resulted in demographics that have long-term bearish
implications for China's economy. Specifically, China's population is aging
at a rapid rate and the ratio of males to females is inordinately high.
South Korea, by the way, has a similar problem.
Yuan re-valuation
China's currency, the Yuan, is pegged
to the US$ at a fixed rate, but the fact that China runs a large trade
surplus with the US leads many to conclude that the current rate is too
low and that an upward re-valuation should therefore be made. We agree
that China's government might be contemplating an upward re-valuation,
but not as a result of the trade imbalance with the US. Rather, if the
Chinese Government does do something to increase the value of the Yuan
relative to the US$ we think it will be because the weakening US$ is pushing
up the amount that China has to pay for vital commodity imports such as
oil and copper.
Something else to consider is China's
worsening trade position. China experienced very strong export growth last
year, but this export growth was surpassed by import growth (exports increased
by about 32% while imports increased by about 39%). Therefore, although
the total value of exports exceeded the total value of imports over the
past year China appears to be heading rapidly towards the point where it
will be consistently running a monthly trade deficit. In fact, China
reported a marginal trade deficit in January, meaning that whatever trade
surplus it ran with the US during that month was more than offset by deficits
with other countries. A surge in imports leading to a large trade deficit
is, of course, a natural consequence of a rapid expansion of credit.
If the rate of growth in imports continues
to exceed the rate of growth in exports then China's leaders might perceive
a stronger Yuan to be in their best interests because it would result in
lower prices for imports. In this case, though, China's growing overall
trade deficit would probably prevent any action from being taken on the
currency front. If, on the other hand, the rate of import growth slows
due to a slowing of the Chinese economy then China's policy-makers will
have an incentive to maintain strong export growth and will not likely
do anything to weaken that growth.
Our guess, therefore, is that over
the remainder of this year there will be a lot of talk, but no action,
as far as the Yuan's value is concerned.
Commodities
in non-US$ terms
Overview
In terms of the euro and other relatively
strong currencies commodity prices have been a lot more docile, over the
past few years, than they have been in US$ terms. Or, to put it another
way, a lot of the strength we have recently seen in the CRB Index has been
a result of US$ weakness as opposed to 'real' strength in commodities.
This is not something that has escaped our attention and neither has it
been a surprise to us since anticipated US$ weakness was one of the main
reasons we went on record, during the dark days of Q4 2001, as saying that
commodity prices were about to embark on a large multi-year rally.
The response of the commodity markets
to a weakening US$ over the past two years is not materially different
from what happened during the 1970s. In fact, we can't think of a reason
why there would ever be a huge, broad-based, multi-year rally in
commodity prices if not for inflation and its effects on the relative values
of the fiat currencies. For instance, if the US$ were as good as gold then
the long-term chart of the CRB Index would, we think, approximate a horizontal
line with a few minor oscillations. As an aside, a chart of the CRB/gold
ratio covering the past 30 years does not approximate a horizontal line;
but that's because the price of gold, under the current monetary
system, tends to experience disproportionately large swings in both directions
in response to changes in confidence.
Further to the above, if it is reasonable
to assume that the US$ is in a long-term bear market then it is equally
reasonable to assume that US$-denominated commodity prices are immersed
in a long-term bull market. Also, taking note of how US$ inflation has
affected US$ commodity prices it is reasonable to assume that commodity
prices are eventually going to move much higher against all the currencies
that have been, and continue to be, inflated at rapid rates. In other words,
against all the major fiat currencies since they are all experiencing
rampant inflation. After all and as explained at TSI many times over the
past 3 years, when the supply of money increases at a rapid rate over an
extended period it is axiomatic that prices will rise somewhere in the
economy. The only thing we need concern ourselves with is WHICH prices.
Current Market Situation
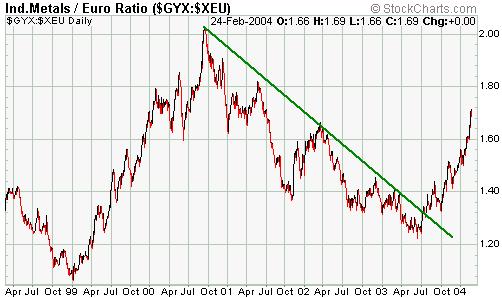
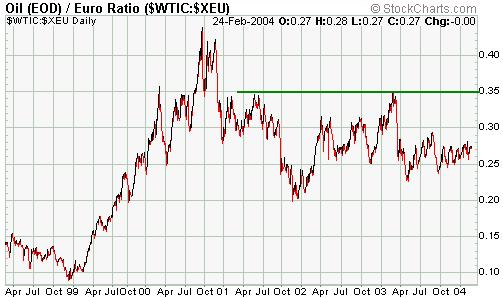
Below are 6-year charts of the Industrial
Metals Index (GYX) in terms of the euro and the oil price in terms of the
euro.
GYX/euro moved sharply higher between
the beginning of 1999 and September of 2000. It then 'corrected' for more
than 2.5 years and made a higher low in June of 2003 before surging anew.
If the advance that began in mid-2003 turns out to be of similar length
and magnitude to the one that occurred during 1999-2000 (at this stage
of the game it looks quite similar) then GYX/euro will peak in May of 2005
at around 2.3 (about 35% above its current level).
Like GYX/euro, oil in terms of the
euro rocketed higher between the beginning of 1999 and September of 2000.
However, rather than pulling back and then resuming its ascent, as has
been the case with GYX/euro, oil/euro pulled back and then went into an
extended sideways consolidation. Its chart is therefore not as bullish
as the GYX/euro chart because there is no firm evidence, at this stage,
that a correction low is in place (for the correction that began in September
of 2000).
The US
Stock Market
Current Market Situation
The results of the latest Investors
Intelligence (II) sentiment survey show that 82.6% of newsletter writers
were bullish on the stock market as at the end of last week. This is close
to an all-time high. Furthermore, this 82.6% comprises 60.2% who are both
near-term and longer-term bulls and 22.4% who are longer-term bulls but
expect a pullback in the near-term. Once again, this 60.2% figure for near-term
bulls is close to an all-time high.
The results of sentiment surveys are
used as contrary indicators because historical data shows that market participants
and investment advisors tend to be at their most bullish near important
market peaks and at their most bearish near important market bottoms. However,
while a major peak won't ever occur unless there are a majority of bulls
and a major bottom won't ever occur unless there are a majority of bears,
there have been periods when sentiment has remained near an extreme for
an inordinately long time. For example, the below decisionpoint.com chart
showing the Investors Intelligence bull and bear percentages reveals that
newsletter writers, as a group, were relentlessly bearish for about 9 months
prior to the start of the huge 1995-1998 advance in the stock market; and
that they have been relentlessly bullish over the past 10 months. In fact,
over the 16 years covered by this chart there has never been a period of
such persistent bullishness as the one that began in May of 2003 and continues
to this day (the only period that comes close is November-1998 through
to July-1999).
The current sentiment situation doesn't
preclude the possibility of new recovery highs over the coming months.
Rather, it is simply an indication of risk because it means there are a
lot of potential converts to the bearish case and very few potential converts
to the bullish case.
The below chart of Intel (NASDAQ: INTC)
shows that this bellwether tech stock is close to breaking down. A decisive
close (preferably a weekly close) below 29.50 would signal a break of support
and project a move down to $25-$26.
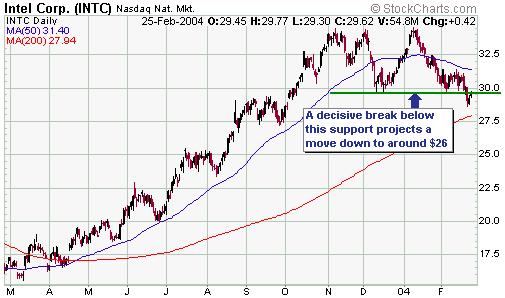
It will be very interesting to see
where the market closes on Friday. For instance, as mentioned above Intel
is quite close to breaking down. Also, if the NDX manages to end this week
below its January low of 1458 it will be a sign that the current correction
is going to continue for at least another month and add to our confidence
that a major peak is already in place for the NDX.
As an aside, Alan Greenspan has stepped
out of his 'monetary policy shoes' over the past few days and cautioned
about the fast growth of the Government Sponsored Enterprises (Fannie Mae,
Freddie Mac) and the problems the government might have in meeting future
social security obligations. We don't know why the Fed Head would be going
out of his way to discuss these issues unless he just wants to make sure
he is on record as having provided timely warnings when the 'brown stuff'
eventually hits the fan.
Gold and
the Dollar
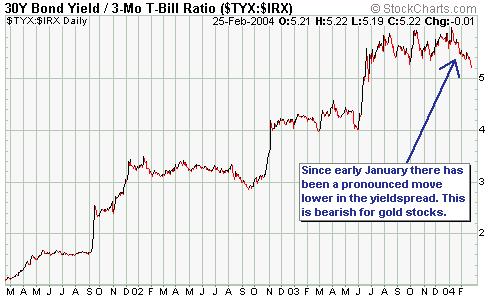
Yield-Spread Update
One of the most important influences
on gold stocks is the spread between long-term and short-term interest
rates. Specifically, a rising yield-spread -- caused by long-term rates
rising faster than or falling slower than short-term rates -- is bullish
for the gold sector whereas a falling yield-spread is bearish.
One way to measure the yield-spread
is to divide the yield on the 30-year T-Bond by the yield on the 13-week
T-Bill, and when we chart this ratio (see below) we see that the interest-rate
backdrop has been bullish for gold stocks over much of the past 3 years.
We also see that although the long-term trend remains positive there has
been a pronounced downturn in the yield-spread over the past 7 weeks.
The yield on the 13-week T-Bill is
unlikely to move significantly lower than its current level of 0.94%. In
fact, the 13-week yield is much more likely to move higher than lower over
the next several months. Therefore, if there are going to be any further
substantial gains in the yield-spread they will almost certainly have to
come about due to a surge in long-term interest rates (lower bond prices).
Now, in the current environment higher
long-term rates will most likely only occur if there is additional strength
in the US$; and US$ strength is a negative for gold and gold stocks. In
other words, if long-term rates began to move higher then any short-term
benefit that gold stocks would normally receive as a result of a widening
yield-spread would probably be counteracted by a stronger US$ and its effect
on the gold price.
If we look at what happened in June-August
of last year we see that gold stocks did not immediately benefit from the
sharp up-move in the yield-spread that occurred when the bond price collapsed.
This was because the bond-price collapse occurred concurrently with, and
partly as a result of, a US$ rally. However, once the dollar stopped rallying
and bonds stopped falling gold stocks took-off like scalded cats. That
is, even if a rising yield-spread fails to boost gold stocks in the short-term
it sets up conditions that allow for sharply higher gold-stock prices once
the pressure of a rising dollar is removed.
Current Market Situation
In the latest Weekly Update we argued
that an intermediate-term bottom was probably not in place for the US$,
but that the current counter-trend move would probably extend for another
month or so. The wild currency-market action over the first three days
of this week has done nothing to alter this view.
The below daily chart of March euro
futures shows a downside breakout from the short-term channel. This breakout
projects a drop to around 119, which happens to be close to the 200-day
moving average and just above support defined by the October high. Also,
118 would be the technical target created by a move below the support that
exists at around 123.50 (the January lows).
There's a chance that the January lows
will hold any further decline in the euro, but a drop to 118-119 over the
next 4-6 weeks looks more likely.
Last Friday's market action indicated
that the correction in the gold market was not over and set up a likely
downside target of $380 (+/- $3). We think $380 is a reasonable target
because it is just above the May-2003 peak in the gold price (the most
important short-term support level once support at 390-395 is breached)
and in the general vicinity of the 200-day MA. Also, if we look at the
price action from a wave perspective -- something we do from time to time
-- we see what appears to be a typical A-B-C correction in the making.
In this case, making the assumption that Wave C will equal Wave A gives
us a target of $383 during the first half of March.
As discussed in the latest Weekly Update
and in many other commentaries, there has been a strong tendency for gold
to lead the US$ over the past few years; so if, for example, the dollar
rebound is going to continue for another 4-6 weeks (a reasonable expectation)
then we should expect gold to bottom within the next two weeks.
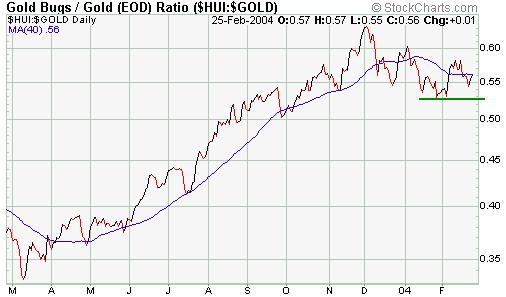
Below is a chart showing the HUI/gold
ratio and its 40-day moving average. As gold works its way towards a correction
low what we should see is some stabilisation in the major gold stocks,
resulting in HUI/gold remaining above its January/February lows.
We expect a multi-month up-move in
the gold sector to get underway within the next few weeks -- perhaps following
a test of the HUI's early-February low -- and that the best performers
during this up-move will be the exploration/development-stage juniors and
the unhedged South African majors. However, Newmont Mining is likely to
be one of the strongest stocks near the end of the correction and during
the initial part of the next up-swing because it is widely perceived
to be the safest gold stock and because it should be less affected by any
panicky liquidation of small traders/investors. We'll therefore be watching
NEM closely over the coming weeks.
Update
on Stock Selections
 From
a valuation perspective Desert Sun Mining (TSX: DSM) is, at its current
price of C$1.43, one of the best buys we know of in the gold sector. The
company currently has a 1M ounce reserve, a 4M ounce resource, and existing
mining infrastructure at its gold project in Brazil. Also, the reserve
and resource numbers are likely to increase over the course of this year
(to 2M and 5M, respectively) and the company expects to bring its mine
into production over the next 12 months at the annual rate of 100,000 ounces.
All this and DSM has an enterprise value (market cap + net debt) of only
C$60M. From
a valuation perspective Desert Sun Mining (TSX: DSM) is, at its current
price of C$1.43, one of the best buys we know of in the gold sector. The
company currently has a 1M ounce reserve, a 4M ounce resource, and existing
mining infrastructure at its gold project in Brazil. Also, the reserve
and resource numbers are likely to increase over the course of this year
(to 2M and 5M, respectively) and the company expects to bring its mine
into production over the next 12 months at the annual rate of 100,000 ounces.
All this and DSM has an enterprise value (market cap + net debt) of only
C$60M.
It's possible that DSM will get cheaper
over the next few weeks, but we doubt that it will get a lot cheaper.
Northgate
Exploration (TSX: NGX, AMEX: NXG) announced some good profit results after
the close of trading on Wednesday, although these results shouldn't come
as a surprise to the market.
NGX's biggest problem is its 350K ounces
of forward sales. The company has a plan in place to eliminate these hedges
over the next 4 years, but it means that about one quarter of each year's
production will be sold at around $300/ounce between now and 2007.
NGX's biggest positive, as far as investors
are concerned, is the multi-million ounce Kemess North deposit because
the market appears to be attributing almost no value to this deposit. However,
the Kemess North feasibility study is due to be completed in April and
will probably confirm a gold reserve of around 3M ounces. Once this happens
it will be difficult for the market NOT to factor the Kemess North into
NGX's valuation.
The
dispute between IMA Exploration (TSXV: IMR) and Aquiline Resource (TSXV:
AQI) over the Navidad discovery in Argentina appears to be about to heat-up
again. Refer to this Mineweb article for details: http://trinity.mips1.net/mgan.nsf/UNID/TWOD-5WHSZZ?OpenDocument
As mentioned in the past, we don't
think there is any downside here for AQI aside from the fact that a protracted
legal battle would absorb a lot of management time.
Chart Sources
Charts appearing in today's commentary
are courtesy of:
http://stockcharts.com/index.html
http://www.decisionpoint.com/
http://www.futuresource.com/

|
