|
- Interim Update 25th March 2009
Copyright
Reminder
The commentaries that appear at TSI
may not be distributed, in full or in part, without our written permission.
In particular, please note that the posting of extracts from TSI commentaries
at other web sites or providing links to TSI commentaries at other web
sites (for example, at discussion boards) without our written permission
is prohibited.
We reserve the right to immediately
terminate the subscription of any TSI subscriber who distributes the TSI
commentaries without our written permission.
Can counterfeiting be good for the economy?
One of the most popular refrains of recent times goes something like
this: "Bernanke is going to make sure that the US economy doesn't enter
a depression by printing a huge amount of money". However, the people
who make this comment or comments like it never explain exactly how
creating money out of nothing can help the economy. It seems, to us,
that it is just taken as read that monetary inflation will somehow be
beneficial.
In our opinion, part of the problem is that the beginning of the last
depression (the early 1930s) coincided with a sharp decline in the
supply of money, while the 1933-1937 rebound (the Roosevelt mini-boom)
coincided with rising money supply. This has led to the incorrect
assumption that the decline in the money supply CAUSED the depression,
and, by the same token, that boosting the money supply would have
prevented the depression. The people who make this assumption are in
good company in that it was the view favoured by Milton Friedman,
although we suspect that if Dr Friedman were alive today he would be
horrified by the antics of the Bernanke Fed.
The depression of the 1930s was caused by a) the inflation-fueled boom
of the 1920s, and b) the government's attempts to prevent the
corrective process from running its course after the boom inevitably
turned to bust. The monetary inflation and credit expansion of the
1920s made a painful adjustment both inevitable and essential, and this
adjustment was probably nearing its end by late 1932 despite the
economic interventions of the Hoover Administration. In fact, the stock
market bottomed in the third quarter of 1932 and by the first quarter
of 1933 there were signs that the economy was beginning to turn around.
It's quite possible that a sustainable recovery would have begun at
that point, but then along came F.D Roosevelt with program after
program involving increased government spending, greater
regulation/intervention, higher taxation, and monetary inflation. The
increased government spending and monetary inflation of 1933-1936
seemed to give more impetus to the economic turnaround that had already
begun when Roosevelt took office, but the apparent strength proved to
be an illusion. The phony nature of the economic strength came to light
in 1937 after a slight tapping on the monetary brake caused the
mini-boom to collapse into a pile of economic rubble. Rather than
ending the depression, the expansion of the money supply and the other
actions of the Roosevelt Administration extended it by many years.
The reality is that creating more money out of nothing could not have
prevented the depression of the 1930s, but it could have made things
even worse. Here's why.
There are three methods via which a government can finance an increase
in its spending: it can borrow more money from the private sector, it
can increase taxes on the private sector, or it can create new money
out of nothing. The first two methods involve a clear-cut transfer of
savings (purchasing power) from the private sector to the government,
so it should be readily apparent to anyone who understands that the
government uses savings less productively than the private sector that
these methods could only hurt the economy. Some will argue that in the
current situation the government is using its newly-acquired resources
to help those parts of the private economy that are in big trouble, but
this is exactly what we are referring to when we say that the
government does not make the best use of resources. What it is
presently doing is channeling money from productive areas of the
economy into the veritable black hole created by many years of
mal-investment.
The third method via which a government can finance an increase in its
spending is the most popular because it doesn't result in the immediate
and DIRECT transfer of savings from the private economy to the
government. At a superficial level it actually looks like a very
efficient way to get the economy rolling again because it seems as if
the government gets more money to spend without causing the private
sector to have less money to spend (the proverbial "free lunch").
However, financing increased government spending by creating money out
of nothing potentially does even more harm than financing it via the
more direct methods because it results in the SURREPTITIOUS transfer of
savings from the private sector to the government. Because the transfer
of savings is surreptitious (read: invisible to most people) it can
occur on a much grander scale and go on for much longer than the more
direct methods. It also distorts price information, so as well as
siphoning savings from productive endeavours it leads to more
mal-investment.
By way of further explanation, if an X% increase in the money supply
immediately led to an X% decline in money purchasing power then
monetary inflation would not be a big problem. Nor would it be a useful
or popular policy because it would not give the government any
advantage. In particular, if every money-supply increase resulted in an
immediate and proportional upward adjustment to all prices then most
people would realise that whenever the government borrowed new money
into existence it was stealing more of their savings just as surely as
if it had reached into their bank deposits and removed some of the
contents. The popularity of monetary inflation stems from the fact that
its effects are neither immediate nor uniform, a consequence being that
when the government funds itself by inflating the money supply barely
one in one-thousand voters will realise -- until it's too late -- that
their savings have been expropriated.
The way monetary inflation 'works' is that there is initially no
noticeable effect on prices, so the initial recipients of the new money
-- primarily government agencies, in the current situation -- get the
privilege of spending it while it still has its original purchasing
power. When this money is spent it creates the illusion that there are
more savings in the economy than is actually the case, which puts
downward pressure on interest rates and prompts investments that
wouldn't be justified in the absence of the new money (a mal-investment
cycle is hence spawned or magnified). It also puts upward pressure on
some prices, although most prices won't get affected to a significant
degree until much later. Eventually, the new money ripples through the
entire economy and the price increases become broad-based. This is the
point at which the effects of the purchasing-power transfer from the
private economy to the government via monetary inflation start to
become obvious. They become obvious not just in the currency's
depreciation, but also in the economic weakness that stems from the
government's inefficient use of resources as well as from the multitude
of bad investment decisions that were prompted by artificially low
interest rates and false price signals. By this stage, however, so much
time will have elapsed since the original crime that few people in the
economics profession or the media will be able to identify the root of
the problem.
In summary, financing increased government spending by creating money
out of nothing results in a transfer of wealth to the government just
as surely as if there had been a tax increase, but because the transfer
is effected in a sly way it eventually wreaks even more havoc than a
direct tax increase.
There is actually no difference in economic effect between the
government -- via the central bank -- creating money out of nothing and
a private counterfeiter doing the same thing. In both cases the entity
that creates the new money gets something for nothing and the existing
holders of money are robbed of part of their purchasing power. The
difference is in legality and scale -- the central bank's
counterfeiting is legal and it occurs and on a much larger scale than
that of any private operation.
So, the next time somebody makes a statement like "the Fed is going to
make sure that the US economy doesn't slide into a depression by
printing lots of new money", ask them to explain exactly how
counterfeiting on a grand scale will improve the situation.
Commodities
A couple of weeks ago we said that the commodity rebound was probably
about to resume. The following chart of the Continuous Commodity Index
(CCI) shows that it has, indeed, resumed.
The CCI's 200-day moving average looks like a reasonable short-term upside target.
The Stock Market
The
S&P500 Index blasted above resistance at 800 on Monday. It then
pulled back to 'test' its breakout on Tuesday and Wednesday, trading as
low as 791 on Wednesday before rebounding to end the day at 814.
The price action and 150 years of stock market history suggest that
there will be additional gains over the coming weeks and months, but
the market was never able to fully clear the 'overbought' condition
that developed last week before resuming its advance. This could mean
that the S&P500 spends some time in the high-700s or low-800s
before making significant additional gains.
Gold and
the Dollar
The Global Currency
The financial crisis of the past two years and the resulting turbulence
in the foreign exchange market has spawned calls for a new currency to
be the primary means of payment in international trade. This new global
currency would take over the role currently performed by the US$ and
would probably be modeled along similar lines to the Special Drawing
Rights (SDRs) used by the IMF. In its present form the SDR is a basket
of currencies comprising the US$, the euro, the Pound and the Yen, but
the main advocates of such currency market reform -- most notably the
Chinese and the Russians -- would prefer that the new global currency
were based on a broader index/basket of currencies. Naturally, the
Chinese and the Russians would prefer that the Yuan and the Ruble were
incorporated into the new currency.
On the surface it seems that the introduction of a new "global
currency" would be viewed by US policymakers as an unappealing
prospect, but this is not necessarily so. To the detriment of freedom
and economic growth, the world is currently dominated by "Keynesian"
thinking; and as Murray Rothbard noted a long time ago, a world with a
single fiat currency controlled by one World Central Bank is the
Keynesian Dream. Under such a monetary system there would be far more
scope to inflate at will because the changes in currency exchange rates
that inevitably arise when one country inflates faster than another
would be removed from the equation. To quote Rothbard: "[Keynesians]
have long dreamed of a world without gold, a world rid of any
restrictions on their desire to spend and spend, inflate and inflate,
elect and elect. They have achieved a world where governments and
Central Banks are free to inflate without suffering the limits and
restrictions of the gold standard. But they still chafe at the fact
that, although national governments are free to inflate and print
money, they yet find themselves limited by depreciation of their
currency. If Italy, for example, issues a great many lira, the lira
will depreciate in terms of other currencies, and Italians will find
the prices of their imports and of foreign resources skyrocketing."
For the reason mentioned above, policymakers in the US would probably
be in favour of a new global fiat currency provided that the US were
able to exert considerable influence over the new currency. Other
countries would naturally want to reduce US influence, but the reality
is that there won't be genuine progress -- if you can call it progress
-- towards a global currency without US support.
If it is implemented in the near future there is very little chance
that the new global currency will include a gold component. This is
because no government will limit its ability to inflate until it is
left with no other choice. Having said that, we don't think it is
reaslistic to expect that a new global currency will be implemented
within the next few years. By the time it is implemented it is quite
possible that things will, indeed, be so bad that governments will be
forced to limit their respective abilities to inflate by bringing gold
back into the official monetary system.
Finally, it is important to understand that the US$ isn't the world's
dominant currency solely because central banks choose to keep most of
their reserves in dollars. If every central bank in the world decided
tomorrow to stop treating the US$ as the reserve currency the US$ would
still be the world's dominant currency. The fact is that the US$ is the
only universally-accepted fiat currency.
Gold
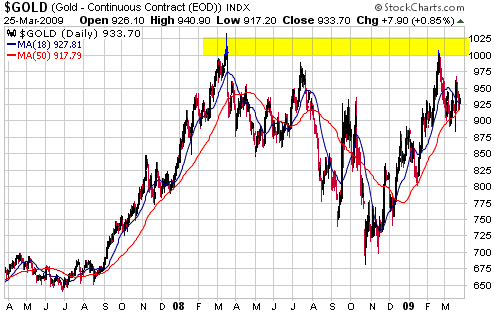
A daily chart of gold, highlighting major resistance at around $1000, is displayed below.
This week's pullback in the gold price found support near the 18-day
and 50-day moving averages, and doesn't make the gold chart look any
less bullish than it did at the end of last week. In fact and as
discussed below, the short-term outlook has become slightly more
bullish because the $20 decline in the gold price over the past three
days was accompanied by gains in the gold-stock indices (a positive
divergence).
Sentiment continues to be an obstacle facing gold in the short-term in
that the sentiment indicators we follow reveal just as much optimism
right now as they did when gold was peaking at $1000 last month.
Pullbacks in upward trends serve a useful purpose if they shake out the
'weak hands', but it seems that hardly anyone was shaken out by the
February-March pullback in the gold market. Another obstacle is
presented by the stock market's rebound and the reduction in risk
aversion that it implies.
In other words, the price action looks bullish, but at the same time
there are good reasons NOT to expect the next large
(multi-hundred-dollar) advance to get underway in the near future.
Further to the above, we certainly won't be surprised if gold re-tests
major resistance at $1000 within the next few weeks, but we doubt that
there will be a sustained break to new all-time highs anytime soon. Our
opinion is that gold will leave $1000 behind before the end of this
year, but probably not during the first half.
With regard to the short-term downside risk, a daily close below $900
would be a more bearish development now than it would have been last
week. Due to the relatively high level of speculative enthusiasm in the
gold market at this time we suspect that a break below $900 would lead,
over the ensuing weeks, to a decline to the low-$800s.

Gold Stocks
Current Market Situation
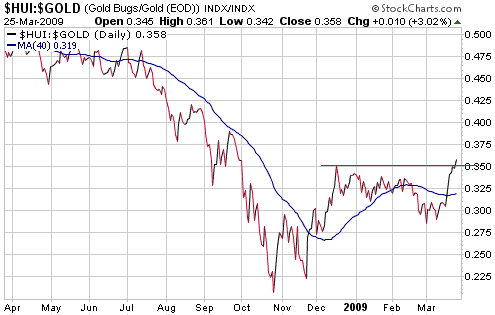
The HUI has risen to a new multi-month high even though the gold price
is $20 below last week's closing price and $60 below its 20th February
peak. This has enabled the HUI/gold ratio to break above its
mid-December peak, eliminating the bearish divergence between the HUI
and the HUI/gold ratio that began to develop in February. The following
chart shows the breakout.

The HUI's rise from
its October-2008 low has now matched the first leg of its 2000-2006
bull market in terms of percentage gain, but the advance will have to
continue until mid April for the current intermediate-term upward trend
to match the duration of the HUI's shortest previous intermediate-term
advance.
HUI/gold's breakout increases the probability that the
intermediate-term advance will extend beyond April, but it's important
to take things one step at a time. At this stage we expect that there
will be additional gains over the coming weeks and continue to view the
350-380 range as the most reasonable upside target for the HUI.
If the broad stock market remains firm or at least stable then gold
will probably have to do no more than return to the high-900s to propel
the HUI to the aforementioned target range. As we've stated a number of
times over the past few months, gold stocks have a lot of catching up
to do.
The Juniors
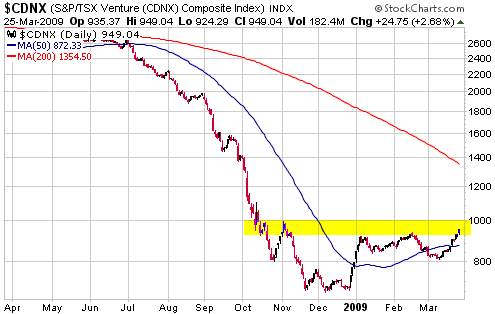
The TSX Venture Exchange is dominated by small-cap mining companies.
Consequently, the TSX Venture Exchange Composite Index (CDNX) is a
reasonable proxy for the junior mining sector. The following daily
chart shows that the CDNX is currently testing resistance and that a
break above 1000 would complete the basing process that began last
October.

Although the CDNX
includes many junior gold stocks, most gold juniors have done much
better than the CDNX over the past 5 months. This is as it should be
because at the same time as all junior mining stocks were being
pummeled last year in response to the panic away from risk and into
cash, the mineral deposits owned by the gold juniors were becoming much
more valuable thanks to large gains in the real gold price.
Despite the strong rebound of the past few months, most junior gold
(and silver) stocks remain very under-valued. Large additional gains
are therefore likely, but it is usually impossible to predict the
timing of the gains. It regularly happens that an under-valued junior
with seemingly excellent prospects lies dormant for a long time, and
then suddenly, for no apparent reason, springs to life. This is just
one reason why exposure to the junior mining sector should be spread
over a number of stocks (at least 7, but no more than 15).
With regard to the management of our own accounts, we often clip some
gains following a quick-fire run-up of 100% or more even if we
anticipate additional large gains by the stock in question over the
coming 12 months. We might then re-deploy some of the liberated cash
into a stock that appears to be basing in preparation for a run-up,
although a lot of our buy/sell decisions depend on our existing
exposure. For example, a quick run-up in a stock is more likely to
prompt some selling on our part if we have a big position in the stock.
The last point we want to make is that while it is sensible to scale
into stocks during pullbacks and to scale out during upward surges, it
is generally a mistake to make a complete exit from a relative-strength
leader solely because it becomes short-term 'overbought'. To avoid the
frustration of being invested in stocks that spend an inordinately long
time going nowhere while the overall market marches upward, we like to
have a smattering of stocks that currently have the attention of the
speculating community and a smattering of stocks that are likely to
capture that attention in the future.
Currency Market Update
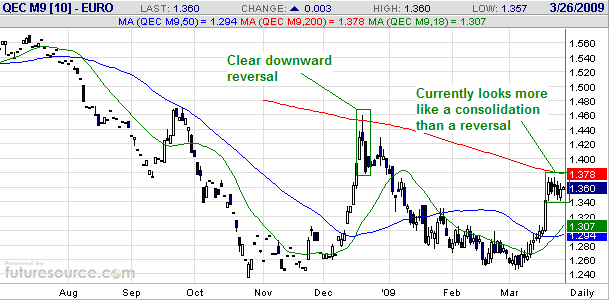
The euro moved sharply higher last December and then reversed lower
after touching its 200-day moving average. The ensuing decline took the
currency back to near last year's low.
As at the end of last week a similar pattern appeared to be unfolding
in that the euro had risen sharply over the preceding fortnight and had
halted at its 200-day moving average. As was the case in December the
euro began to pull back after touching its moving average, but as noted
on the following daily chart the price action since last week's peak is
looking more like a consolidation within an upward trend than a
downward reversal.

Update
on Stock Selections
(Note: To review the complete list of current TSI stock selections, logon at http://www.speculative-investor.com/new/market_logon.asp
and then click on "Stock Selections" in the menu. When at the Stock
Selections page, click on a stock's symbol to bring-up an archive of our comments on the stock in question)
 Northgate Minerals (AMEX: NXG, TSX: NGX). Shares: 256M issued, 263M fully diluted. Recent price: US$1.40 Northgate Minerals (AMEX: NXG, TSX: NGX). Shares: 256M issued, 263M fully diluted. Recent price: US$1.40
Due to the combination of its relatively low risk and substantial
upside potential, we think NXG has one of the best risk/reward ratios
in the gold sector. This is a 400K-oz/yr producer with operations in
politically secure locations trading at well below 3-times expected
2009 cash flow.
With reference to the following daily chart, NXG is currently testing
resistance defined by its 200-day moving average and has short-term
lateral resistance defined by its February peak in the low-US$1.50s.
Once through the aforementioned short-term resistance there will be no
significant chart-related obstacles until it reaches intermediate-term
resistance at US$2.50.
Chart Sources
Charts appearing in today's commentary
are courtesy of:
http://stockcharts.com/index.html
http://www.futuresource.com/

|

